

In the video below, I show an example of performance analysis of a WordPress plugin. Performance optimisation is firstly performance analysis – you need to find out where your performance bottlenecks are.
Performance bottlenecks in WordPress are most commonly found in the database, so a plugin tool like Query Monitor can help a great deal. If you want to do performance analysis and optimisation properly however, break out the big-boy tools.
Table of Contents
Percona Toolkit
To gather all the SQL queries into a league table, I set up the slow-query log for PerconaDB/MySQL to record every SQL query. See this post for a guide how to do that: https://www.superspeedyplugins.com/2016/07/26/enable-slow-query-log-and-identify-slow-queries-percona-db/
I’m using a value of long_query_time = 0 to catch all queries.
XDebug Profiler
To analyse the PHP bottlenecks, use XDebug Profiler. Don’t bother with the likes of P3 Performance Profiler – as the results from it are total garbage.
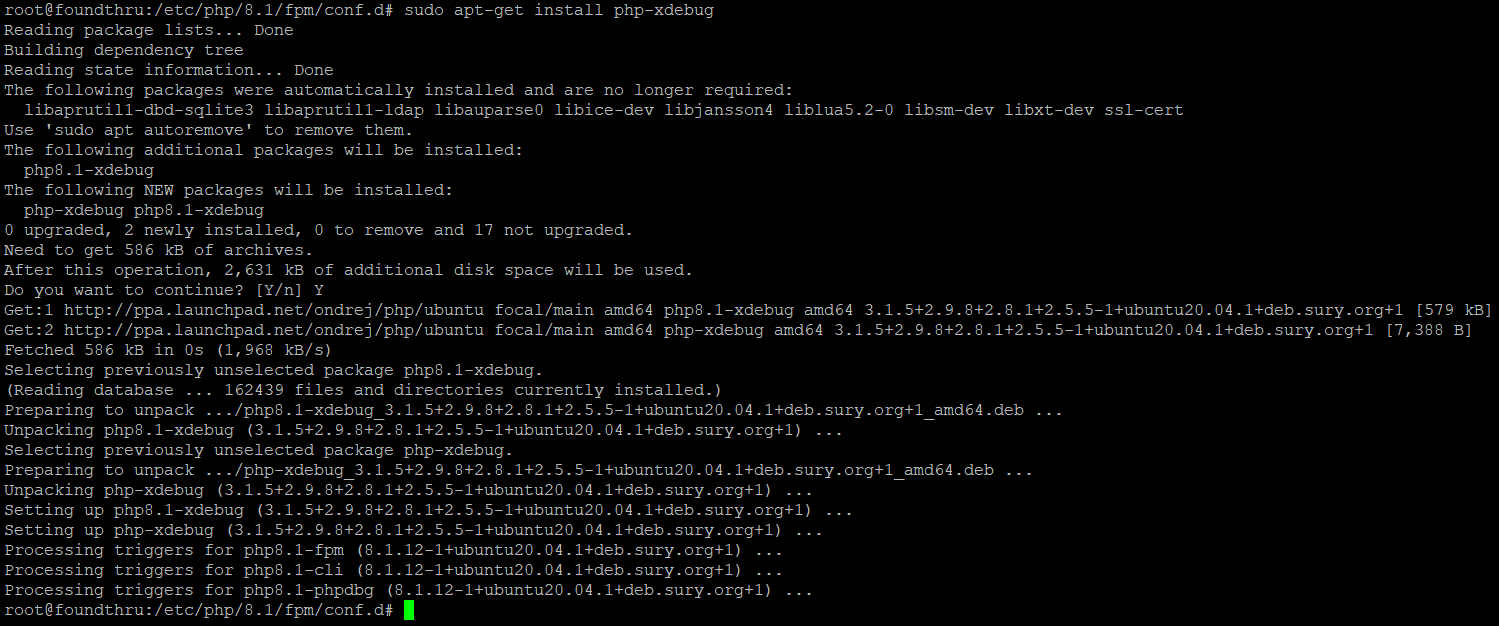
To set up the Xdebug profiler, follow my guide here: https://www.superspeedyplugins.com/2016/07/26/profiling-wordpress-php-code-using-xprofiler/
I’m using the profiler to grab everything because this is a cron-based plugin, but you can use the trigger option from the page above if you need to.
An almost complete picture of performance
With the 2 tools above you’ll get all the SQL bottlenecks and all the PHP bottlenecks. There are other things that can affect performance, but I’m not covering them here – just to enumerate some of them I’m not considering, here’s a list:
- Network/bandwidth
- OS config/Memory congestion/thrashing
- Server config/disk speed/CPU speed
- Competiting resources – e.g. other activities on the server, load etc
In this example, I’m running my performance analysis on a development server and I know the specs. I also have a duplicate reference server with the original code and identical set up so I can run side-by-side performance comparisons after optimisation.
Analysing Performance
First of all, download the XDebug Profiler trace for whatever you’re tracing and open it with QCacheGrind. I use the Callee Map tab, like in this screenshot:
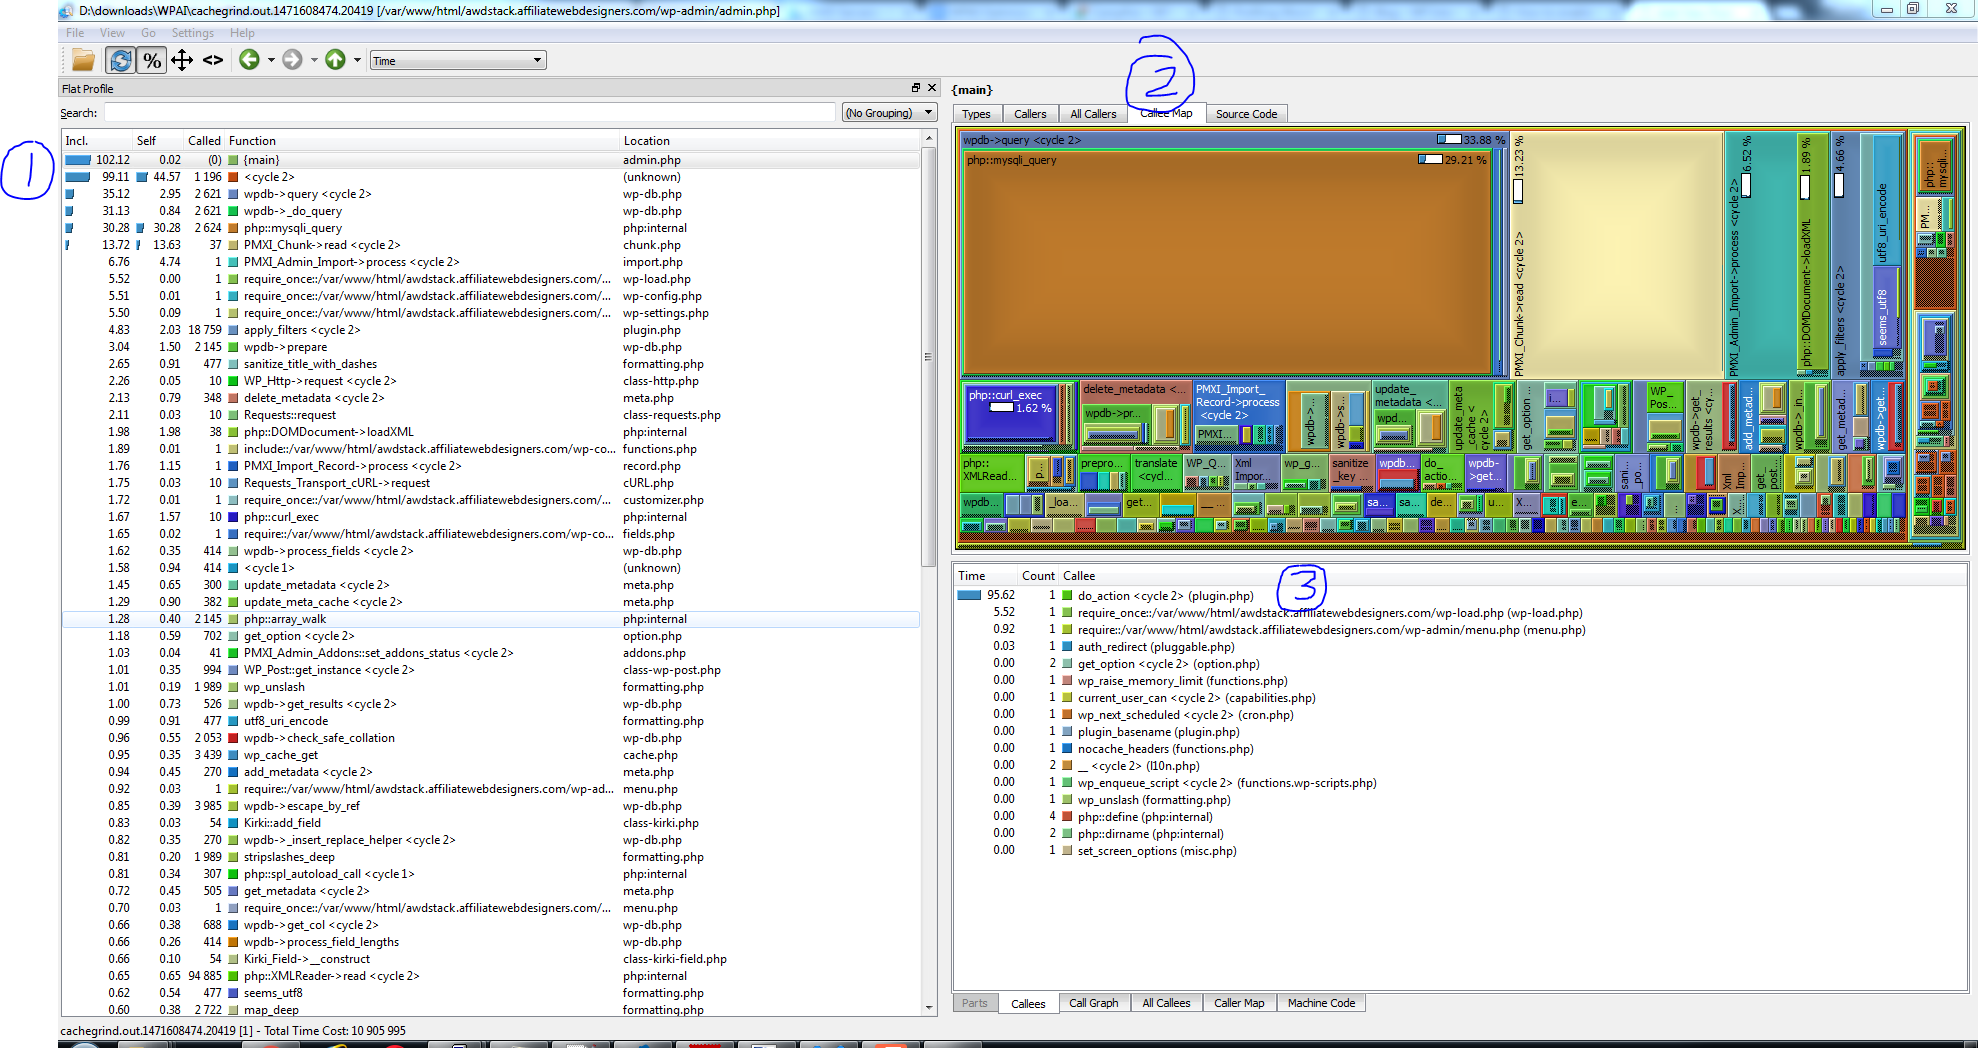
The items I’ve marked on the screen:
- This is the ordered list of expensive items – most expensive at the top automatically. The first column, Incl, shows total time by this function including its children. Column 2 shows just the time used by this function, excluding its children. Then you have the number of calls, the function name and where it comes from.
- This is the callee map – pretty cool – you can see the big chunk of 33% is wpdb->query, then the next 3 items take up about 25% of the total execution time of this first function (do_action). The next 3 are: PMXI_Chunk, PMXI_Admin and apply_filters. Each of these boxes can be drilled into to view performance details about that specific item
- The third part down the bottom shows more info – you can alter this to show charts of callers and callees.
So we have 3 target areas to look at really – SQL Queries, PMXI_Chunk and PMXI_Admin.
Here’s a screenshot of the pt-query-digest results:
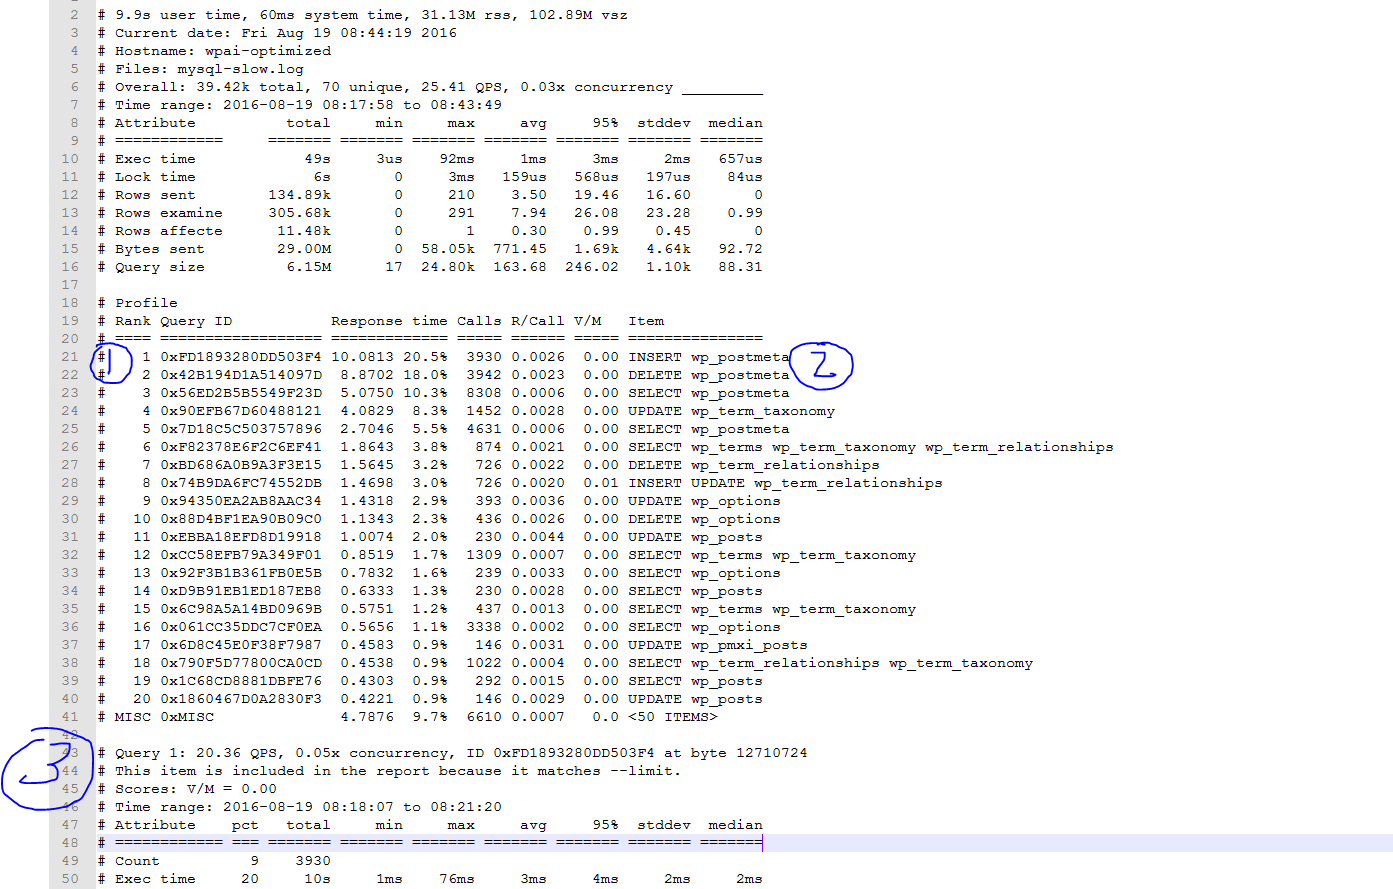
What you’re looking at above is:
- The rank of the query along with the total % time this type of query has consumed – the queries at the top are your biggest targets – optimise them for most impact
- This right hand column shows you a basic summary of the query
- The rest of the report covers details about each query type. To show you that, here’s the text for the top 4 queries (I’ve cut out some bumf):
# Query 1: 20.36 QPS, 0.05x concurrency, ID 0xFD1893280DD503F4 at byte 12710724
# ============ === ======= ======= ======= ======= ======= ======= =======
# Count 9 3930
# Exec time 20 10s 1ms 76ms 3ms 4ms 2ms 2ms
# Lock time 7 455ms 36us 1ms 115us 224us 71us 98us
# Rows sent 0 0 0 0 0 0 0 0
# Rows examine 0 0 0 0 0 0 0 0
# Rows affecte 33 3.84k 1 1 1 1 0 1
# Bytes sent 0 53.73k 14 14 14 14 0 14
# Query size 7 498.77k 91 776 129.96 258.32 126.56 97.36
# Tables
# SHOW TABLE STATUS FROM `awdstackdb` LIKE 'wp_postmeta'G
# SHOW CREATE TABLE `awdstackdb`.`wp_postmeta`G
INSERT INTO `wp_postmeta` (`post_id`, `meta_key`, `meta_value`) VALUES (2399, '_product_version', '2.6.4')G

# Query 2: 20.32 QPS, 0.05x concurrency, ID 0x42B194D1A514097D at byte 10645618
# ============ === ======= ======= ======= ======= ======= ======= =======
# Count 10 3942
# Exec time 18 9s 485us 92ms 2ms 4ms 3ms 2ms
# Lock time 4 253ms 31us 897us 64us 144us 52us 44us
# Rows sent 0 0 0 0 0 0 0 0
# Rows examine 1 3.85k 1 1 1 1 0 1
# Rows affecte 33 3.85k 1 1 1 1 0 1
# Bytes sent 0 42.35k 11 11 11 11 0 11
# Query size 2 188.63k 49 49 49 49 0 49
# Tables
# SHOW TABLE STATUS FROM `awdstackdb` LIKE 'wp_postmeta'G
# SHOW CREATE TABLE `awdstackdb`.`wp_postmeta`G
DELETE FROM wp_postmeta WHERE meta_id IN( 48049 )G
# Converted for EXPLAIN
# EXPLAIN /*!50100 PARTITIONS*/
select * from wp_postmeta WHERE meta_id IN( 48049 )G

# Query 3: 42.82 QPS, 0.03x concurrency, ID 0x56ED2B5B5549F23D at byte 73914
# ============ === ======= ======= ======= ======= ======= ======= =======
# Count 21 8308
# Exec time 10 5s 177us 10ms 610us 2ms 576us 424us
# Lock time 14 937ms 41us 2ms 112us 348us 121us 66us
# Rows sent 2 3.85k 0 1 0.47 0.99 0.50 0
# Rows examine 38 119.08k 0 29 14.68 27.38 8.14 14.52
# Rows affecte 0 0 0 0 0 0 0 0
# Bytes sent 2 809.26k 95 105 99.74 102.22 4.75 92.72
# Query size 10 667.26k 74 97 82.24 88.31 4.92 80.10
# Tables
# SHOW TABLE STATUS FROM `awdstackdb` LIKE 'wp_postmeta'G
# SHOW CREATE TABLE `awdstackdb`.`wp_postmeta`G
# EXPLAIN /*!50100 PARTITIONS*/
SELECT meta_id FROM wp_postmeta WHERE meta_key = '_product_url' AND post_id = 2224G

# Query 4: 7.52 QPS, 0.02x concurrency, ID 0x90EFB67D60488121 at byte 5430080
# ============ === ======= ======= ======= ======= ======= ======= =======
# Count 3 1452
# Exec time 8 4s 527us 57ms 3ms 5ms 2ms 3ms
# Lock time 2 172ms 42us 879us 118us 214us 70us 103us
# Rows sent 0 0 0 0 0 0 0 0
# Rows examine 0 1.42k 1 1 1 1 0 1
# Rows affecte 12 1.42k 1 1 1 1 0 1
# Bytes sent 0 73.73k 52 52 52 52 0 52
# Query size 1 103.78k 72 74 73.19 72.65 1 72.65
# Tables
# SHOW TABLE STATUS FROM `awdstackdb` LIKE 'wp_term_taxonomy'G
# SHOW CREATE TABLE `awdstackdb`.`wp_term_taxonomy`G
UPDATE wp_term_taxonomy SET count = count + 1 WHERE term_taxonomy_id = 836G
# Converted for EXPLAIN
# EXPLAIN /*!50100 PARTITIONS*/
select count = count + 1 from wp_term_taxonomy where term_taxonomy_id = 836G
The most immediately useful parts here are the query examples – so I copy/paste them into mysql and stick the word EXPLAIN at the front, e.g.
explain select * from wp_postmeta WHERE meta_id IN( 48049 );
In this case, when I run this query against the database, it’s using an index so there’s not much I can do to optimise here using SQL techniques. However, what I can figure out from the code is that the 3 top queries are actually trying to do an UPDATE statement, and in the vast majority of cases, the update is not required.
i.e. the developer of this code, instead of running an UPDATE SQL statement has instead run a DELETE followed by an INSERT. This was presumably because a DELETE followed by an INSERT requires one less code path. If the data doesn’t already exist, the delete will not do anything and then the insert can run as normal. If the data DOES already exist, it will be deleted before being inserted.
To double check that this is true, I can look in the mysql-slow.log file. What I find is that there are actually many multiple SELECT and then DELETE statements. It makes sense for there to be individual INSERT statements, but not the individual DELETE statements since the DELETE is deleting all the postmeta. Again, it would be better to just to what’s called an UPSERT (update or insert).
So I’ve found my next major performance bottleneck to fix. By looking through the mysql-slow.log file, I searched for the first DELETE against wp_postmeta and found that there are 24 DELETE statements per post. That can be turned into a single statement which will provide roughly 20x speed boost for this section.
Summary
Use XDebug profiler to analyse performance bottlenecks, then drill into the relevant code – either SQL or PHP or both. Use the slow query log and the pt-query-digest tool to help you analyse the SQL queries.
Here’s a video which can help you picture this a little better. Let me know if there’s anything you’d like covered more in-depth for my next videos.


Cheers buddy – thanks for the advice 😉
Hi Dave,
thank you for your informative post and for sharing your expertise – you are doing some interesting work here and I pick up some nice tips from you reading your blog articles.
This may sound like a bit of a silly question given the content of this post, but would you recommend using the same tools to purely analyse theme performance please – or are there different techniques you’d recommend? I don’t want to just analyse database/query performance but especially PHP performance too 😉
Yes – you can use the Xdebug profiler to analyse theme performance too. As you can see from the screenshots in the examples I was doing, I was focused on pages where I knew the plugins were causing slowdown, but if you use the same techniques you can analyse the theme functions and anything basically – it all uses PHP and the Xdebug profiler works at the PHP level.
Btw, its better to use xhprof even in production sites. https://github.com/longxinH/xhprof/
Also good tool is pt-duplicate-key-checker: https://www.percona.com/doc/percona-toolkit/2.2/pt-duplicate-key-checker.html
Check those
Thank you for the links.