

I’ve written in the past about building incredibly fast WordPress stacks, and in our stack maintenance guide I covered a great script to help you optimise your MySQL 8 configuration.
In this guide, I’ll focus on how to record slow SQL queries with MySQL 8 and then how to install and use tools to tell you the source of these slow queries. I’ll also cover various optimisation techniques you can use to conquer the most common MySQL performance issues.
Table of Contents
- Enable your slow query log
- Installing the Percona Toolkit to analyse your MySQL 8 logs
- Analysing the pt-query-digest output
- Optimising your database after analysing pt-query-digest
- Searching for slow queries inside slow.log
- Rewriting Queries
- Provide your slow queries here and I’ll show you how to optimise them
Enable your slow query log
In order to analyse slow queries, you first need to enable your slow query log. Presuming you have a standard MySQL 8 setup, here’s how you would do that. First, you need to create a log folder that MySQL has permissions to write to.
mkdir /var/log/mysql
touch /var/log/mysql/slow.log
chown mysql:mysql -R /var/log/mysql
Next, you need to edit your mysqld.cnf file. Based on our stack guide, this will be located in the following folder:
vi /etc/mysql/mysql.conf.d/mysqld.cnf
Once you have that file open, add the following lines to the end:
slow-query-log = 1
slow-query-log-file = /var/log/mysql/slow.log
long_query_time = 1
log-queries-not-using-indexes
To deconstruct that, the first line above enables the slow log, the 2nd line tells MySQL where to write the slow log, the 3rd line is how long (in seconds) is considered slow and the final line will make MySQL record queries not using indexes.
Once you’ve edited your configuration, you’ll need to restart MySQL.
service mysql restart
You should leave your site running for a day or two to gather normal website traffic so you have something useful to analyse.
Installing the Percona Toolkit to analyse your MySQL 8 logs
The Percona Toolkit includes a tool called pt-query-digest which can analyse the log files generated by MySQL 8.
apt install percona-toolkit
To run the pt-query-digest, run the following command once your slow.log file has enough entries to be useful (a day or two of data should be enough).
pt-query-digest /var/log/mysql/slow.log
Analysing the pt-query-digest output
Once the pt-query-digest is complete, it will provide two sections in its analysis. The first is a ranking league table of your slowest queries affecting your server the most, and the second section goes into more detail for each of these query patterns. Here’s an example of the output:
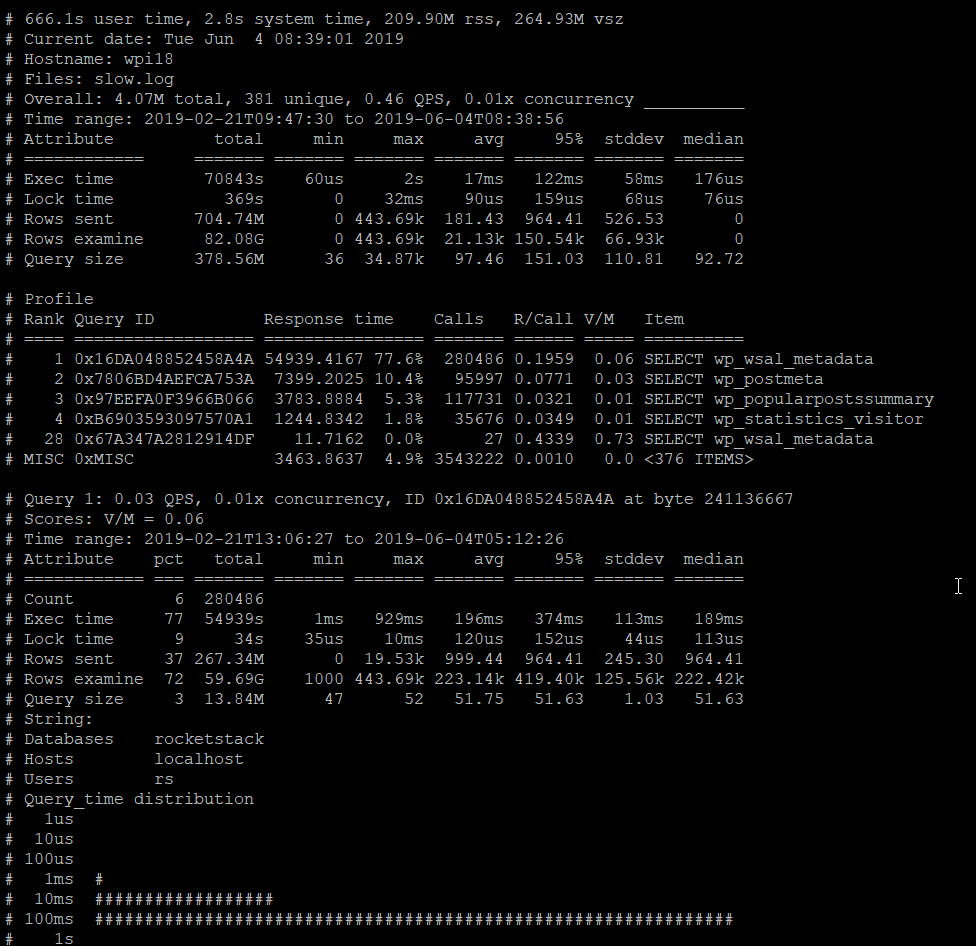
In the example above, you can see 76% of the slow queries are against the wp_wsal_metadata table. These clues are incredibly useful for optimising your server.
Optimising your database after analysing pt-query-digest
The easiest approach is to eliminate plugins that are using up your server resource. In this example, to discover the plugin which is referencing the wp_wsal_metadata table, you can either google wp_wsal_metadata or run a grep to search for this code in your plugin files.
cd /home/826397.cloudwaysapps.com/vaxvhpbyme/public_html/wp-content/plugins
grep wsal_metadata . -R
In the above, I change directory to the plugins folder and then grep for wsal_metadata – note: it’s important to drop wp_ from your search since this prefix is appended by WPDB.
In this case, the WP Security Audit plugin is at fault so I simply removed it.
If you discover slow queries inside plugins that you need to keep, you should try and figure out indexes that can be created to optimise these queries.
Covering query optimisation using indexes is too big an area for this article, but generally these rules help:
- If you have a highly selective WHERE clause, there should be an index on that column
- If you have a JOIN between two tables, there should be indexes on those columns on both tables
- Where possible, you should use covering indexes
Searching for slow queries inside slow.log
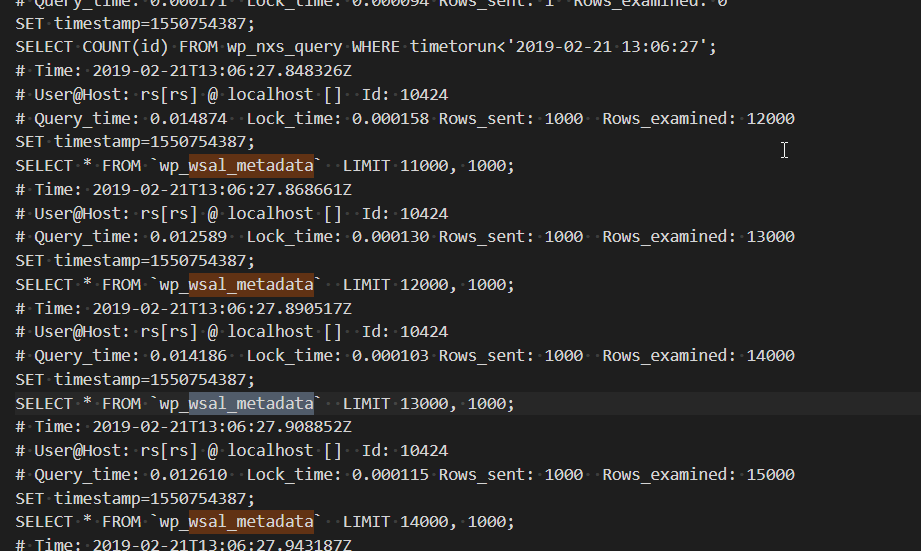
Once you have your league table, you’ll have a search pattern to search for. In addition to performing a grep on your wp-content/plugins folder, you can download your slow.log file and search inside that to find specific queries that were actually slow against your database.
Here’s a screenshot of what I found before I disabled the WP Security Audit plugin:
Rewriting Queries
For backwards compatibility, WordPress WP_Query uses LEFT JOINS a lot rather than INNER JOINS. It also uses GROUP BY statements to ensure you don’t get repeating posts. This is a lot slower than using WHERE EXISTS.
If it’s possibly for you, you can rewrite the queries to use custom SQL queries rather than using WPDB. Again, this is too big an area to go into in this article, but our Scalability Pro plugin covers adding indexes and rewriting the most common slow queries to make them fast, including optimising WooCommerce and your wp-admin area.
Provide your slow queries here and I’ll show you how to optimise them
Once you’ve run your pt-query-digest and discovered slow queries, if you’re struggling to optimise the SQL queries, provide the query here in the comments and I’ll give you directions to optimise those queries using indexes and by rewriting the SQL code.


Hello Dave,
Disclaimer: I’m the author of WP Activity Log 🙂
Interesting write-up. May I ask why you chose to automatically add queries with no indexes and consider them as slow queries?
In this particular case, Indexes would improve the search and filters. However, for 80%+ of the time the plugin is used to write the logs to the database. Only on occasions it is used by a user to look into the logs, or in your case, to migrate the data to the archiving database.
So considering that indexes would result in more writing and data space, this is a very good trade off – the plugin is faster for when it is used for what it was built for, to write logs to a database. The user prefers to wait an extra second or two when searching through the logs rather than having an overall slower website.
Would appreciate your thoughts on the above.
Hey Dave,
I have built 2-3 stacks following your rocketstack guide and working perfectly fine. The 4th one I tried was little big wp site with woocommerce and few other plugins. I was working almost ok while DNS wasn’t pointed; as soon as I did that it became extremely slow. When ran ‘top’ command I was surprised to see that mysql cpu usage is always above 250%, unable to figure out what’s going wrong. It’s a 4vcpu 15gb server on ubuntu 18.04lts. Below is my data from top & processlists commands. PLEASE HELP ME.
top – 10:34:07 up 4 days, 15:00, 1 user, load average: 5.65, 5.66, 5.46
Tasks: 140 total, 1 running, 91 sleeping, 0 stopped, 0 zombie
%Cpu0 : 63.6 us, 0.0 sy, 0.0 ni, 36.4 id, 0.0 wa, 0.0 hi, 0.0 si, 0.0 st
%Cpu1 : 63.6 us, 0.0 sy, 0.0 ni, 36.4 id, 0.0 wa, 0.0 hi, 0.0 si, 0.0 st
%Cpu2 : 63.6 us, 0.0 sy, 0.0 ni, 36.4 id, 0.0 wa, 0.0 hi, 0.0 si, 0.0 st
%Cpu3 : 58.3 us, 8.3 sy, 0.0 ni, 33.3 id, 0.0 wa, 0.0 hi, 0.0 si, 0.0 st
KiB Mem : 15389976 total, 1872508 free, 2712596 used, 10804872 buff/cache
KiB Swap: 0 total, 0 free, 0 used. 12250044 avail Mem
PID USER PR NI VIRT RES SHR S %CPU %MEM TIME+ COMMAND
11559 mysql 20 0 3047232 870016 33736 S 283.3 5.7 5197:46 mysqld
1 root 20 0 225588 9224 6620 S 0.0 0.1 0:20.75 systemd
mysql> show processlist;
+——-+—————–+———–+————–+———+——–+————————+——————————————————————————————————+
| Id | User | Host | db | Command | Time | State | Info |
+——-+—————–+———–+————–+———+——–+————————+——————————————————————————————————+
| 4 | event_scheduler | localhost | NULL | Daemon | 137608 | Waiting on empty queue | NULL |
| 49810 | root | localhost | NULL | Query | 0 | starting | show processlist |
| 49812 | my_db | localhost | astra_zotezo | Query | 9 | executing | SELECT post_id FROM wp_postmeta WHERE meta_key = ‘_wp_attached_file’ AND meta_value = ‘2020/03/final |
| 49813 | my_db | localhost | astra_zotezo | Query | 9 | executing | SELECT post_id FROM wp_postmeta WHERE meta_key = ‘_wp_attached_file’ AND meta_value = ‘2020/03/final |
| 49817 | my_db | localhost | astra_zotezo | Query | 9 | executing | SELECT post_id FROM wp_postmeta WHERE meta_key = ‘_wp_attached_file’ AND meta_value = ‘2020/03/final |
| 49818 | my_db | localhost | astra_zotezo | Query | 9 | executing | SELECT post_id FROM wp_postmeta WHERE meta_key = ‘_wp_attached_file’ AND meta_value = ‘2020/03/final |
| 49819 | my_db | localhost | astra_zotezo | Query | 9 | executing | SELECT post_id FROM wp_postmeta WHERE meta_key = ‘_wp_attached_file’ AND meta_value = ‘2020/03/final |
| 49820 | my_db | localhost | astra_zotezo | Query | 8 | executing | SELECT post_id FROM wp_postmeta WHERE meta_key = ‘_wp_attached_file’ AND meta_value = ‘2020/03/final |
| 49822 | my_db | localhost | astra_zotezo | Query | 7 | executing | SELECT post_id FROM wp_postmeta WHERE meta_key = ‘_wp_attached_file’ AND meta_value = ‘2020/03/final |
| 49823 | my_db | localhost | astra_zotezo | Query | 7 | executing | SELECT post_id FROM wp_postmeta WHERE meta_key = ‘_wp_attached_file’ AND meta_value = ‘2020/03/final |
| 49824 | my_db | localhost | astra_zotezo | Query | 7 | executing | SELECT post_id FROM wp_postmeta WHERE meta_key = ‘_wp_attached_file’ AND meta_value = ‘2020/03/final |
| 49825 | my_db | localhost | astra_zotezo | Query | 7 | executing | SELECT post_id FROM wp_postmeta WHERE meta_key = ‘_wp_attached_file’ AND meta_value = ‘2020/03/final |
+——-+—————–+———–+————–+———
It sounds like you’re using a different theme and this theme is trying to grab something from wp_postmeta.
By default, wp_postmeta doesn’t have a usable index on (meta_key, meta_value).
I highly recommend you get my Scalability Pro plugin and click the button inside there to create indexes which will fix this.
I am using Astra Pro and also have AMP plugin. Are you sure Scalability Pro will solve this? What else it does otherwise?