

I use Xdebug regularly to help clients figure out why their PHP processes are consuming all the CPU. If you haven’t tried it yet, I have an old article covering how to install and configure Xdebug.
In the example below, the object cache is in use, and you can see from the Query Monitor plugin that there’s no SQL-based reason for the page being slow:
- No slow queries
- No queries returning 1000s of rows
- Low query count

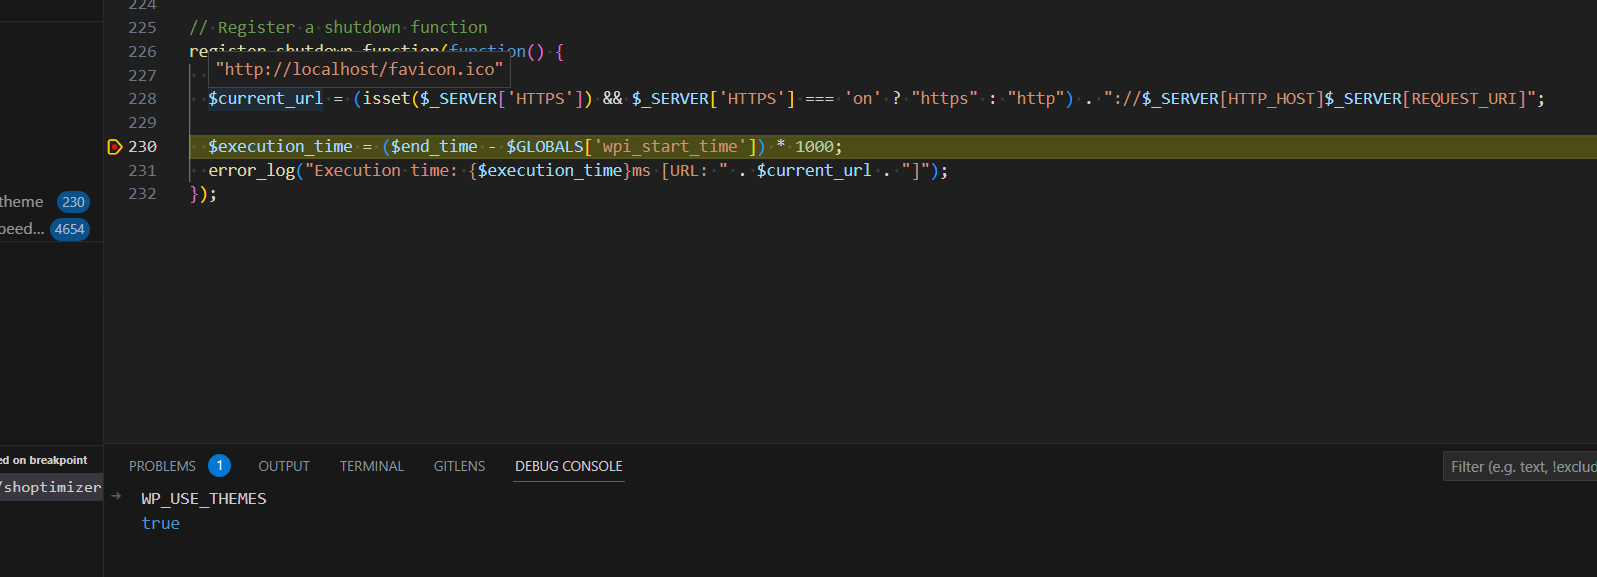
So that’s over 13 seconds of pure PHP processing. I also confirmed that there are no HTTP/API calls happening as that could be another potential cause here, and I used the ‘top’ command in linux to confirm the PHP-FPM process was hogging the CPU while this page was loading.
The page in question is a shop archive, but this shop archive actually is using my Faster Woo Widgets plugin so before starting I was certain it couldn’t be that!
After enabling Xdebug, I ran the page in question with the extra URL parameter to force Xdebug to run and gather data in its cachegrind files. The file generated was 2GB in size, which is pretty big for Xdebug, but if you make sure you get a 64-bit version of qCacheGrind then you’ll be able to read large files like this. It took about 5 minutes to load the page and generate the cachegrind file – this is something to bear in mind if you have a really slow page, it’ll be 20 times slower when you enable full PHP debugging using Xdebug.
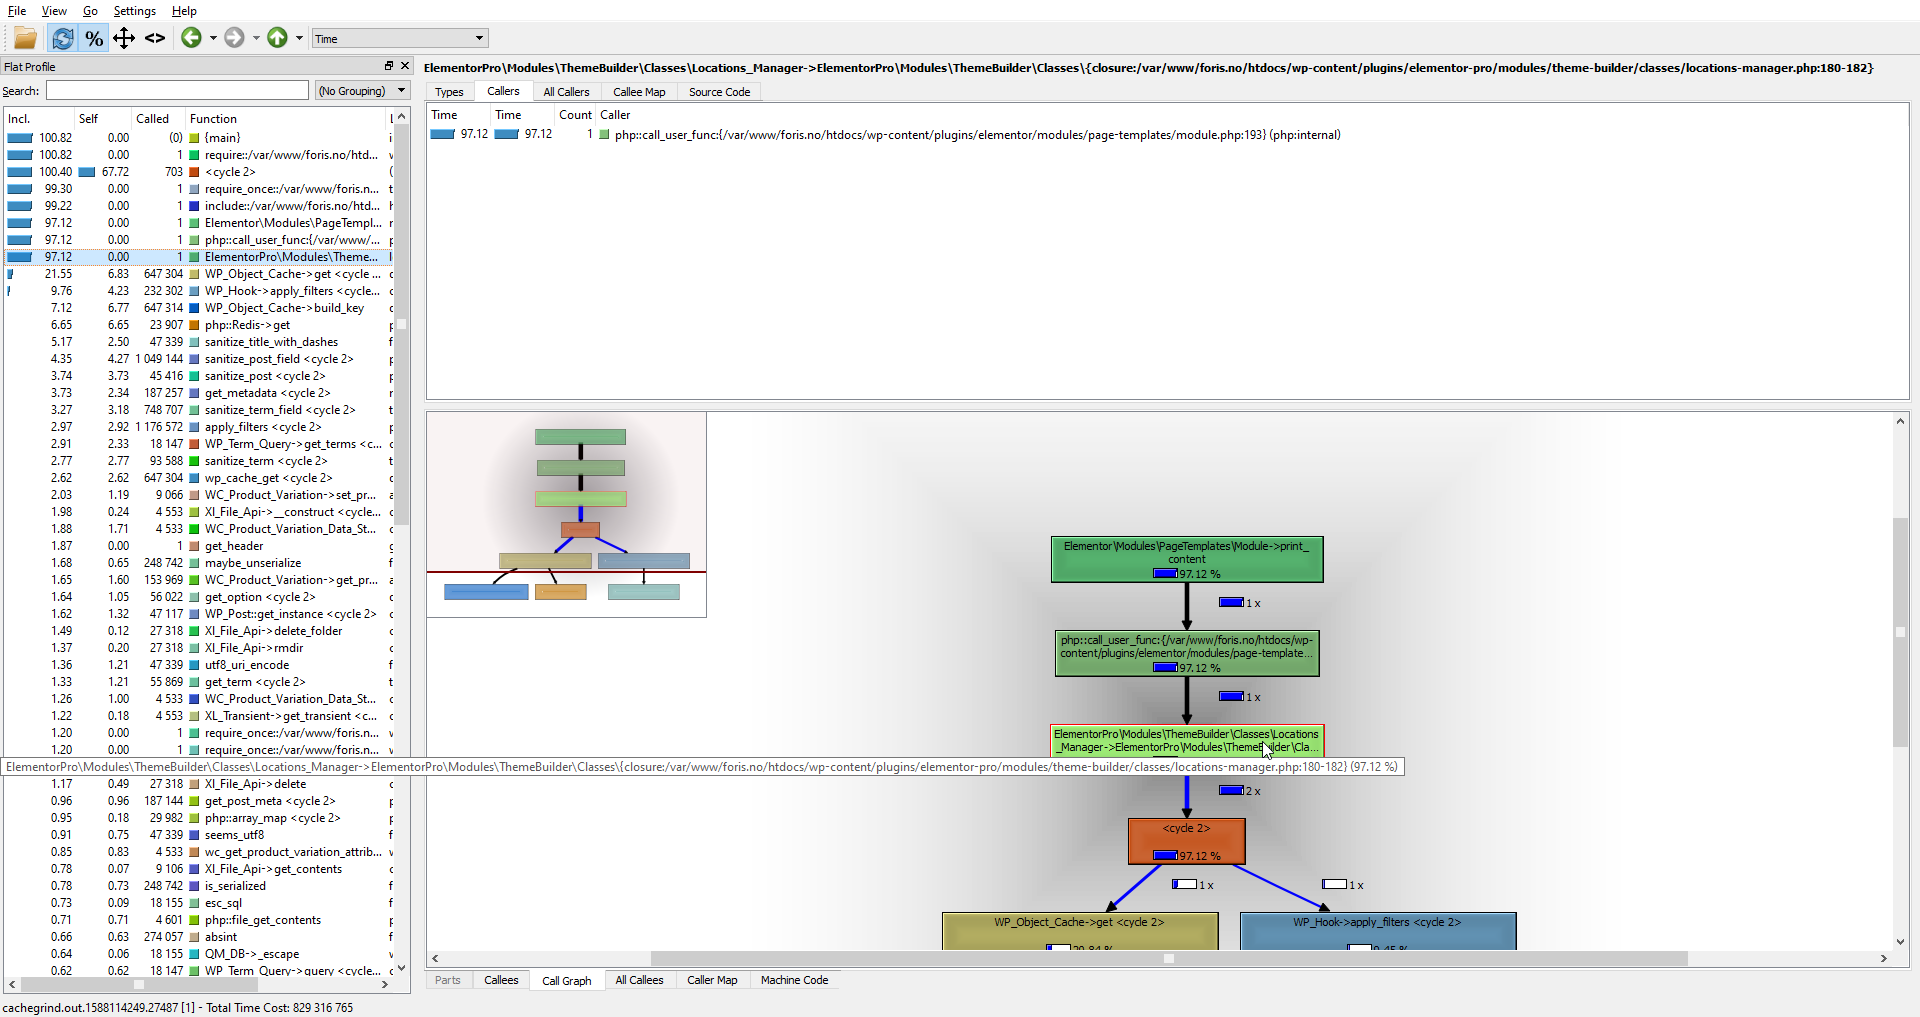
I can see through the above graph that qCacheGrind thinks lines 180 – 182 of an Elementor file are the culprit here:
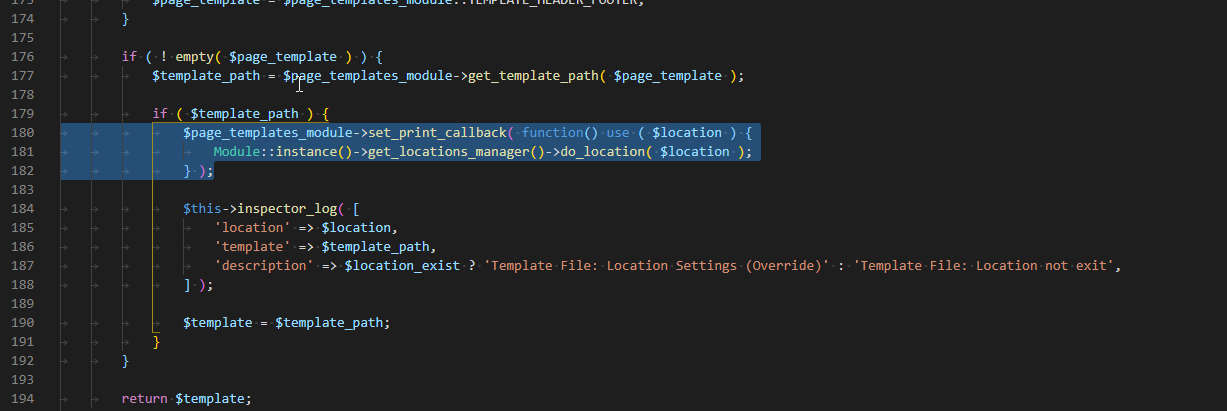
That’s not really much help as this is just loading any templates you’ve added (I dug down on that code to check).
Another way to look at qCacheGrind, especially when looking for PHP CPU consumption, is to order by ‘Called’. The most common problem in code at scale is that someone has coded something inside a loop. They are calling something expensive inside that loop and the number of times it is being called increases as the store gets bigger.
So I ordered the results in qCacheGrind by ‘Called’ then I saw this:
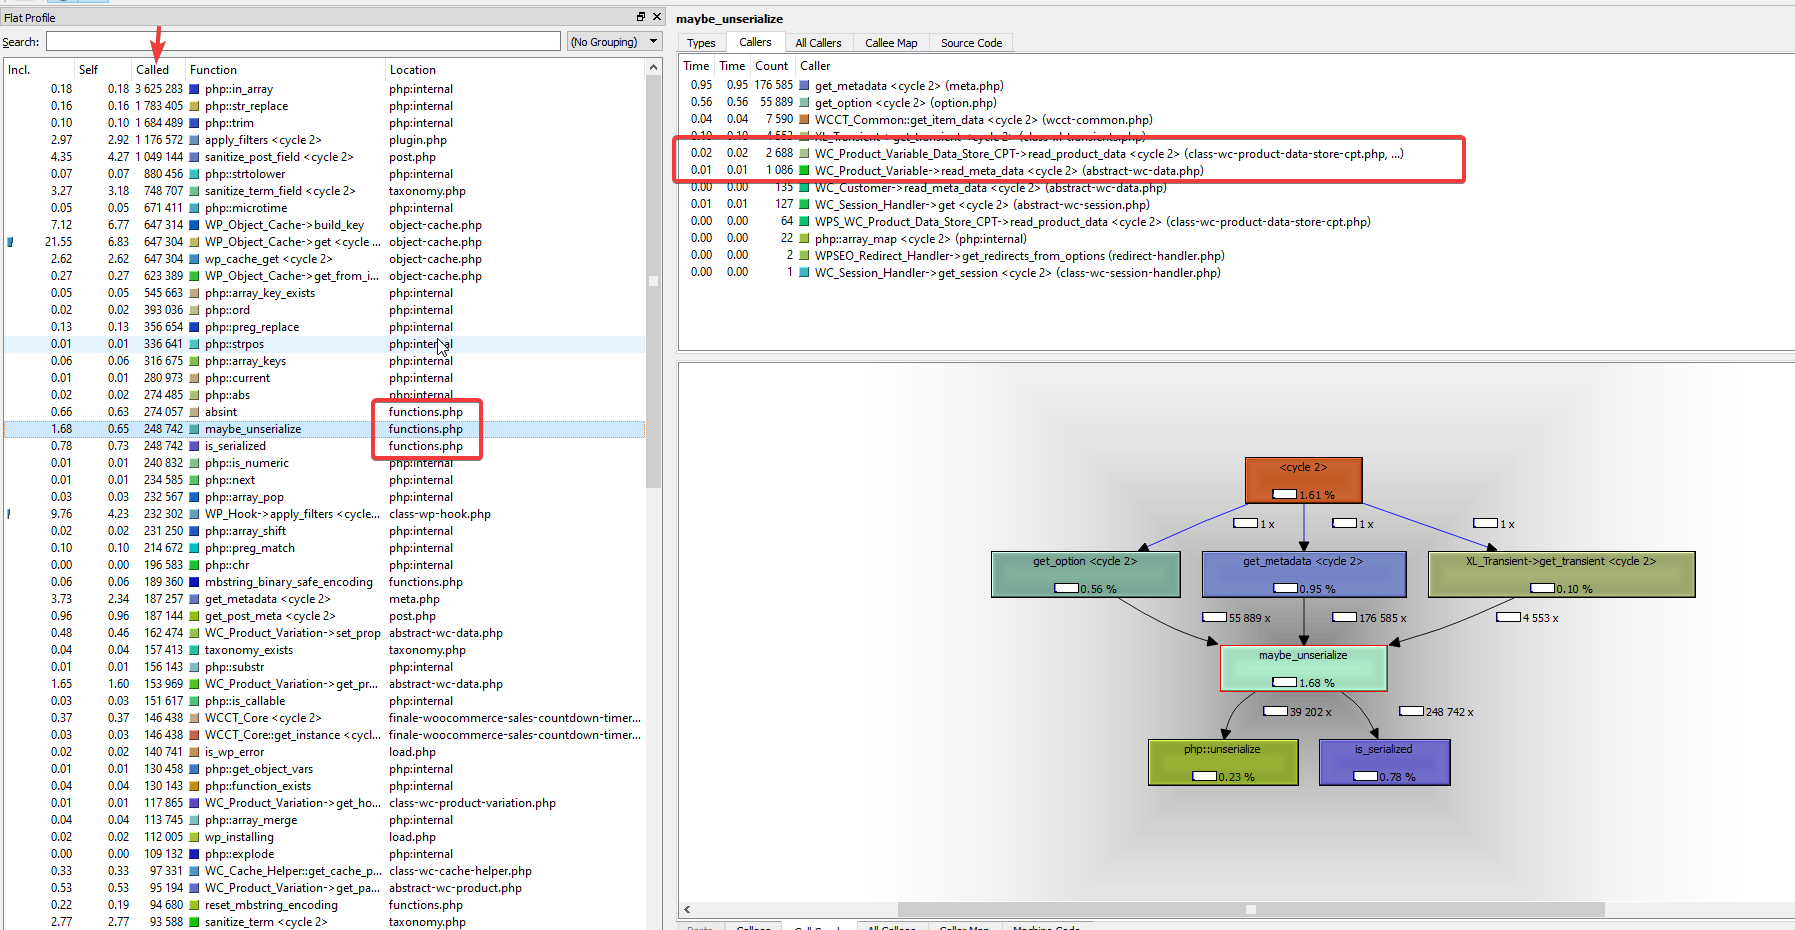
Not the best of clues I’ve ever seen, but what that’s telling me is the the theme functions.php file is – for some reason – fetching product variation data and a LOT of it.
Once I’d seen this, it was a matter of opening up the functions.php file and looking for references to product variations. I found some code the client had pasted from Business Bloomer:
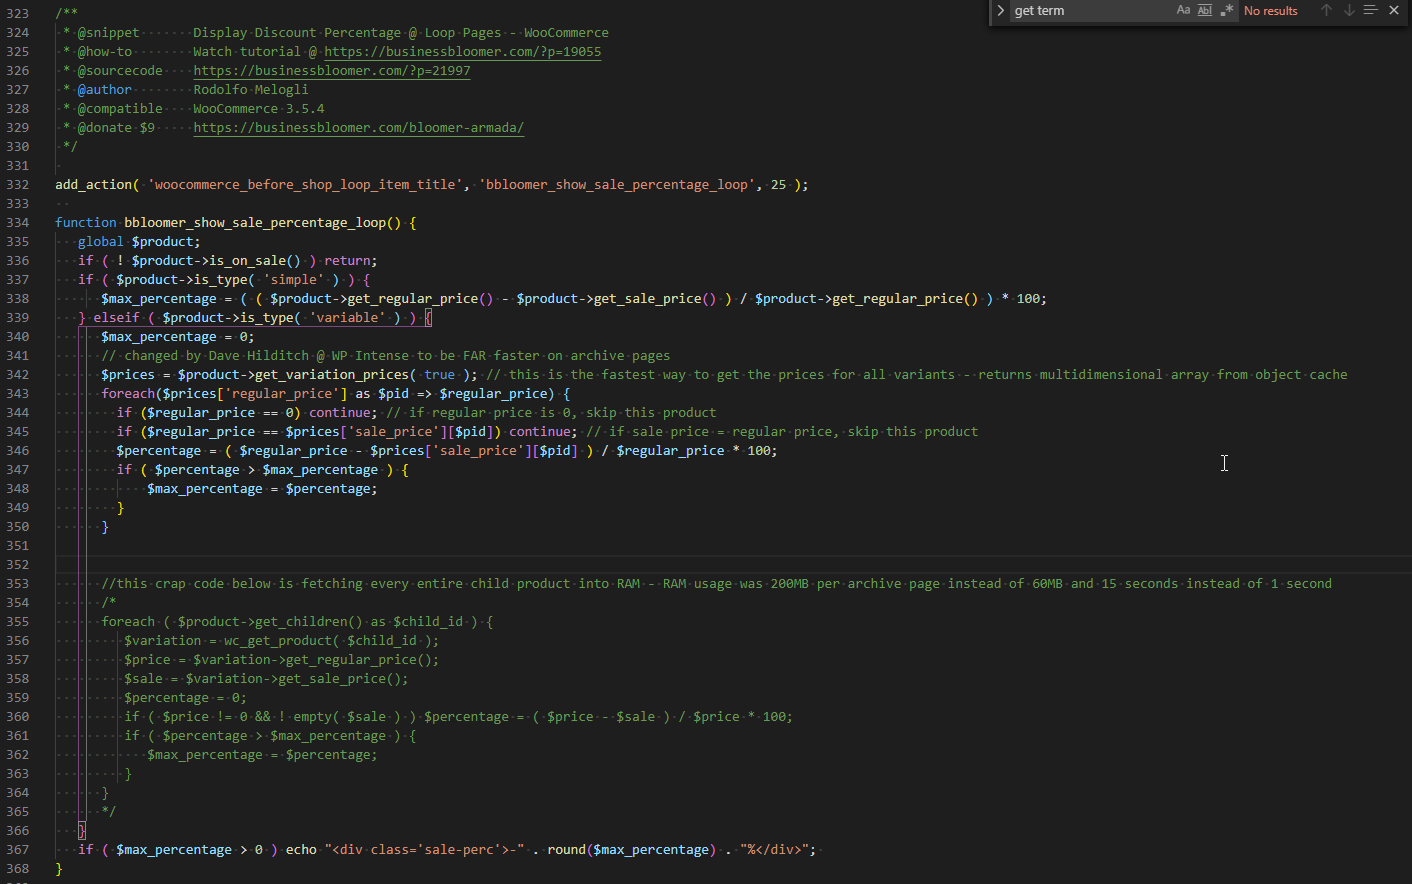
For all products in the archive view, it was looping through every child variation and loading each product into RAM just to grab the sale and regular price. This, so the client could display 20% off on top of the products.
To fix this, there is a get_variation_prices function you can call on the product parent which is actually very fast – it returns an array in a single call of all the prices, and you can see the code above modified to use my approach with the slow approach of loading all the child products into RAM commented out below.
Now, instead of archive pages using 200+MB of RAM, they use 60MB and instead of taking 15 – 20 seconds to generate the page, they now generate in 1 second.
qCacheGrind and Xdebug are not perfect – it takes a while to get used to what these tools are showing you – but if you can install it on your host it can really help you narrow down your performance issues very quickly.


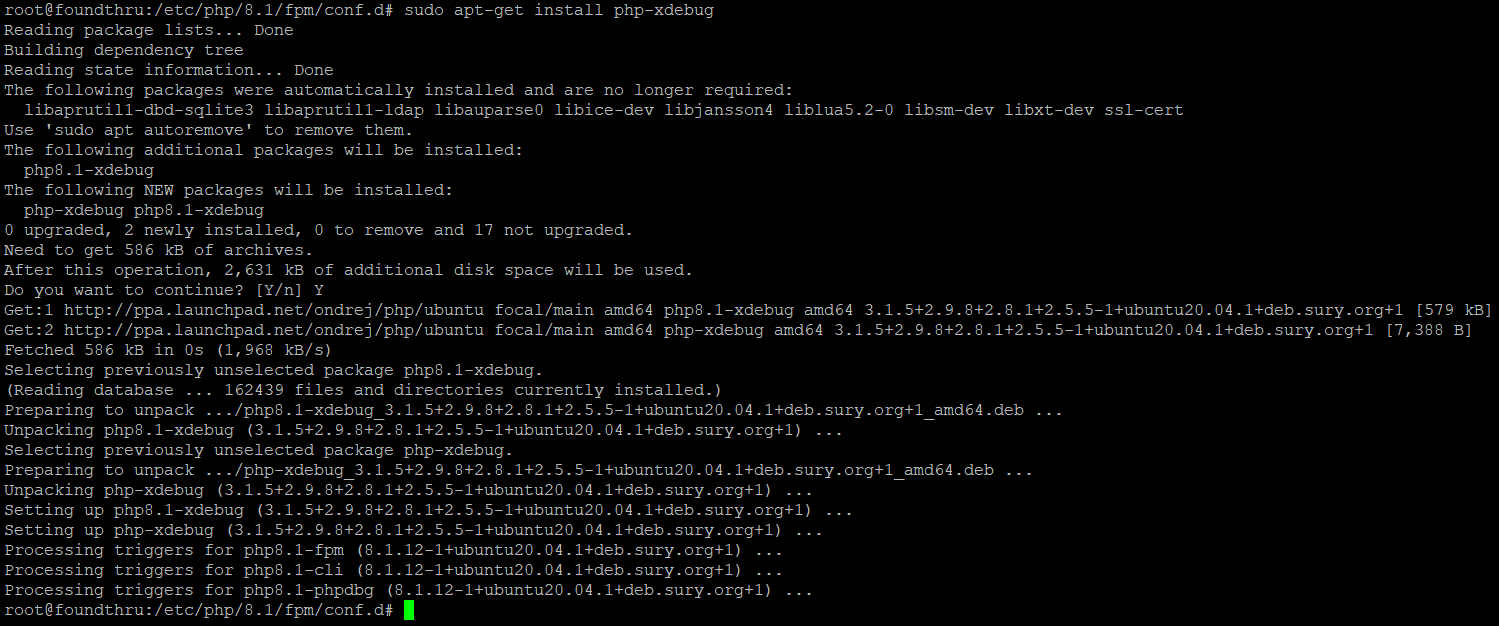


PHP is the main cause of causing massive CPU usage if the server settings optimized properly. Now i will use Xdebug to find why.