

Query Monitor is by far the best tool to analyse WordPress performance bottlenecks. With this tool, you can quickly discover which plugins or even which theme functions are causing your site to slow down.
In this article, I’ll cover how I use Query Monitor when running performance analysis jobs for clients.
Table of Contents
- Installation
- Query Monitor performance overview
- Disable your object cache prior to analysis
- Examine queries by row count to discover the source of high RAM usage plugins or theme features
- Drilling down to discover the source of high row counts
- Examine Queries by Component to find which plugins or theme features cause excessive queries
- Examining Slow Queries
- Eliminating excessive queries and high row counts
- Analysing slow API calls
- Analysing Bulk Edits
- Summary
Installation
Installation is normally straight forward – install the plugin and activate. But, depending on your hosting configuration, in some situations you may need to perform an additional step.
After activation, you will see a new Query Monitor bar on your black wp-admin bar.

When you hover over this section of the bar, you will see a drop-down menu appear.
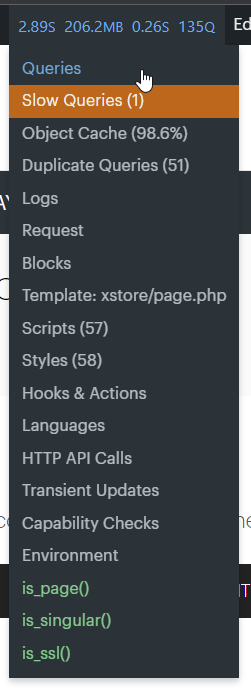
After activation, you should hover over this bar and click Queries. The section that appears from the bottom of the page will tell you whether the Query Monitor plugin is installed correctly or not. What you’re looking for here is to see if the ROWS column appears.
If your hosting prevented the ‘symlink’ from being created then this Rows column will not appear. In addition, there will be a warning message about this on the Queries tab.
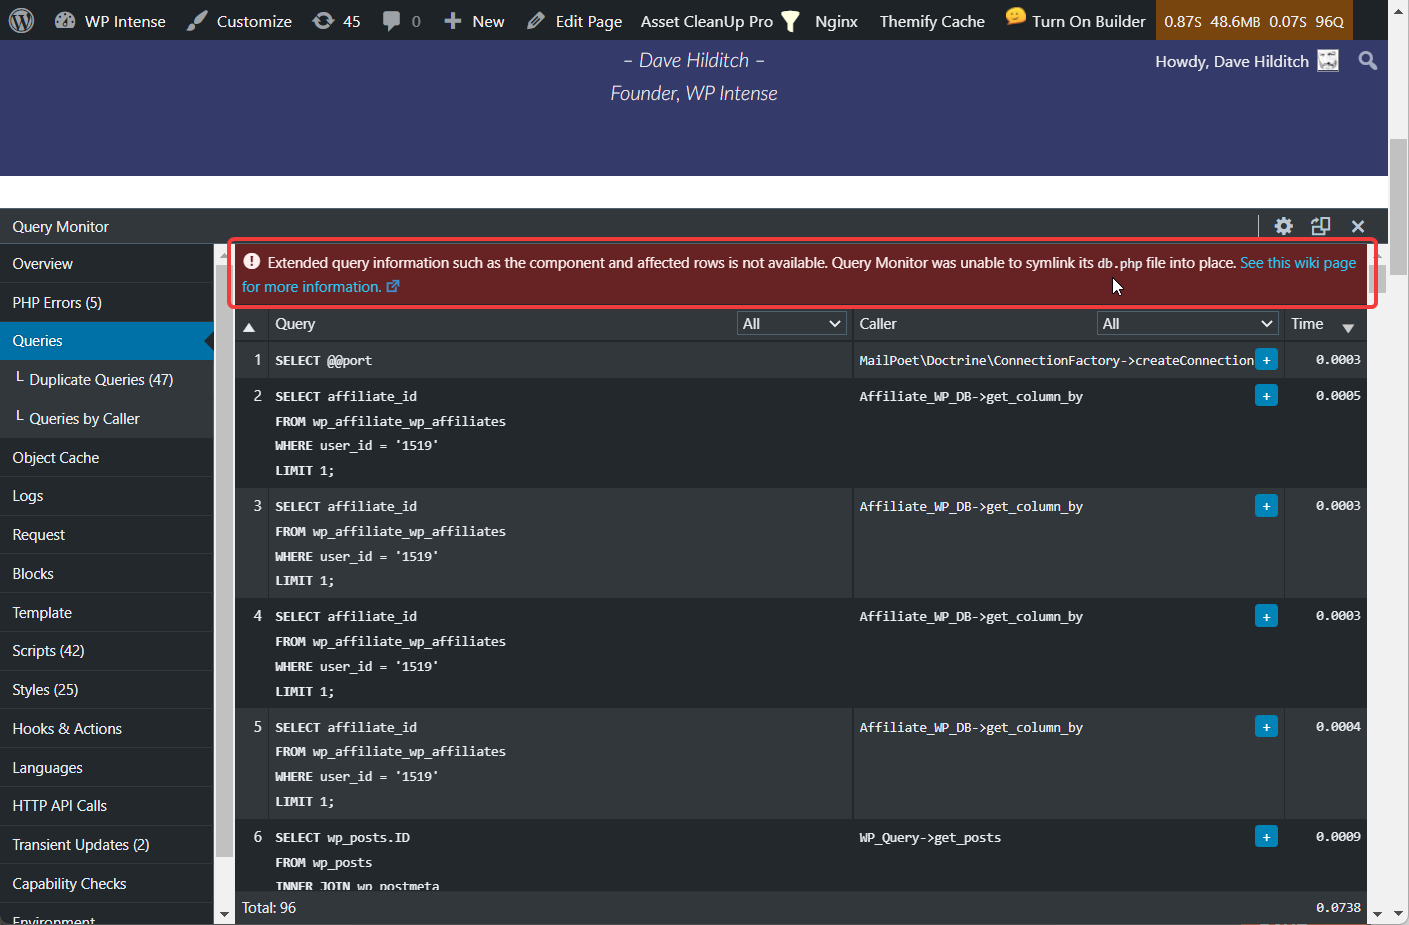
What Query Monitor tries to do is to create a symlink called db.php inside your wp-content folder. This symlink is not actually a file – it points at another file, specifically it points at a file called db.php inside the Query Monitor plugin folder.
In order to properly analyse performance issues, you need the row counts, so if your symlink is missing you should follow the Query Monitor wiki guide to manually fixing the symlink. Basically, you need to SSH onto your server and run the following command – adjusting the paths for the paths of your website:
ln -s /path/to/wordpress/wp-content/plugins/query-monitor/wp-content/db.php /path/to/wordpress/wp-content/db.php
If you do not know how to SSH, or if you cannot SSH, you should ask your hosts for help to configure this. If your hosts cannot help you with this and you cannot do it yourself, you should switch hosts. Seriously.
Once the symlink has been created, refreshing the page, hovering over the Query Monitor bar, and then clicking Queries should show you the row counts.
Query Monitor performance overview
There are a fair number of things that Query Monitor will tell you, straight from the highlight bar.
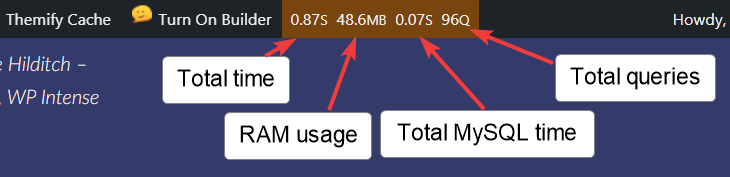
- Total time – page generation time is made up of MySQL time, PHP time and API call time. If there are no API calls then subtracting the total MySQL time from the total time tells you how much time was used by PHP processing the page.
- RAM usage – excessive RAM usage indicates queries returning too much data and leads to lower total concurrent users.
- Total MySQL time – this tells you how much time was spent inside the database fetching data to generate this page
- Total queries – how many queries were executed to generate this page
Disable your object cache prior to analysis
If you are not using an object cache, you really should be. If you are amongst one of the rare users who finds that adding an object cache actually slows your site down, this means you have rogue plugins trying to save far too much data into the object cache. Regardless, to see true underlying performance you need to disable your object cache.
If your hosts cannot provide you with an object cache, change hosts. Seriously.
Any host that does not provide either the Redis object cache or the Memcached object cache is not worth staying with. If you have SSH access, you can install Redis yourself. It’s free. If your host wants to charge you money for Redis, change hosts. Seriously.
It does not require maintenance and it can be automatically installed by halfway decent hosts, you should never have to pay for it. If you have a control panel, there is probably an option somewhere in there to install Redis.
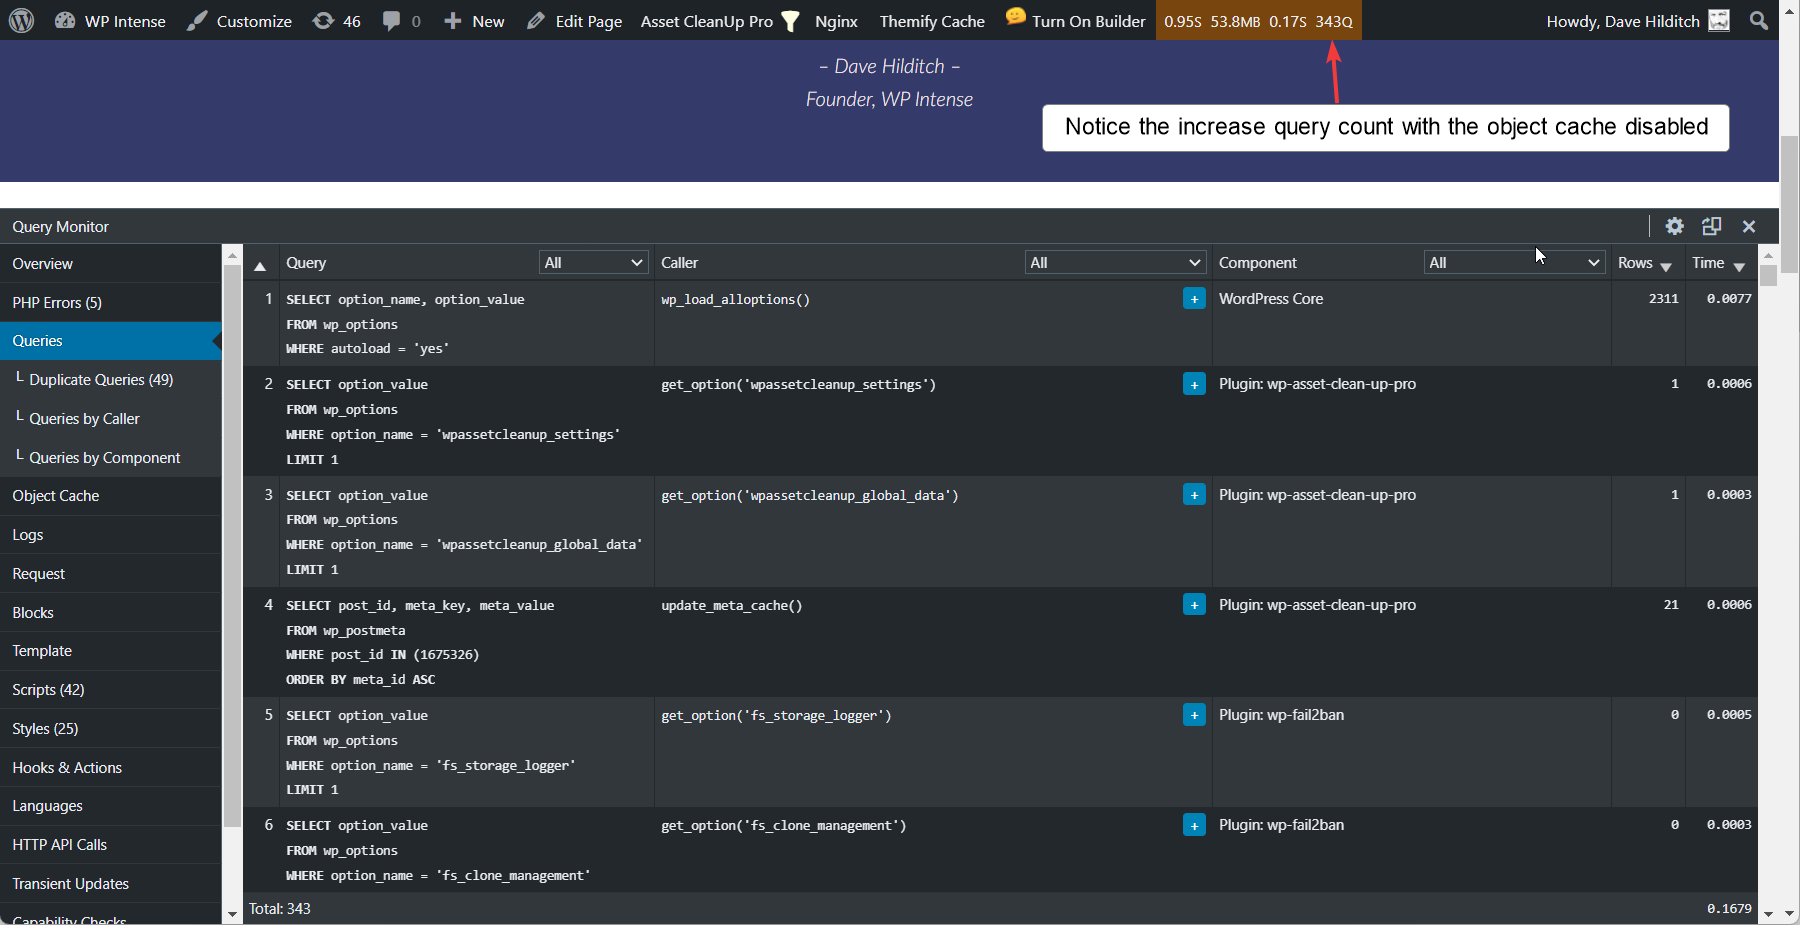
Here is the same page as above loaded with the object cache disabled. Notice the different figures in all areas.
Examine queries by row count to discover the source of high RAM usage plugins or theme features
There are some common WordPress core elements that are cached from page to page inside the object cache including options, postmeta data and more. But regularly you will also find rogue plugins which retrieve an excessive amount of rows from your database.
Plugins or theme features which retrieve 1000s of rows when they only need access to 10s of rows will lead to excessive RAM usage and excessive PHP time. You may find the SQL time is quite low because databases are very efficient at fetching data (normally!). However, if plugins are retrieving 1000s of rows when they do not need to this will lead to high RAM usage and high PHP time.
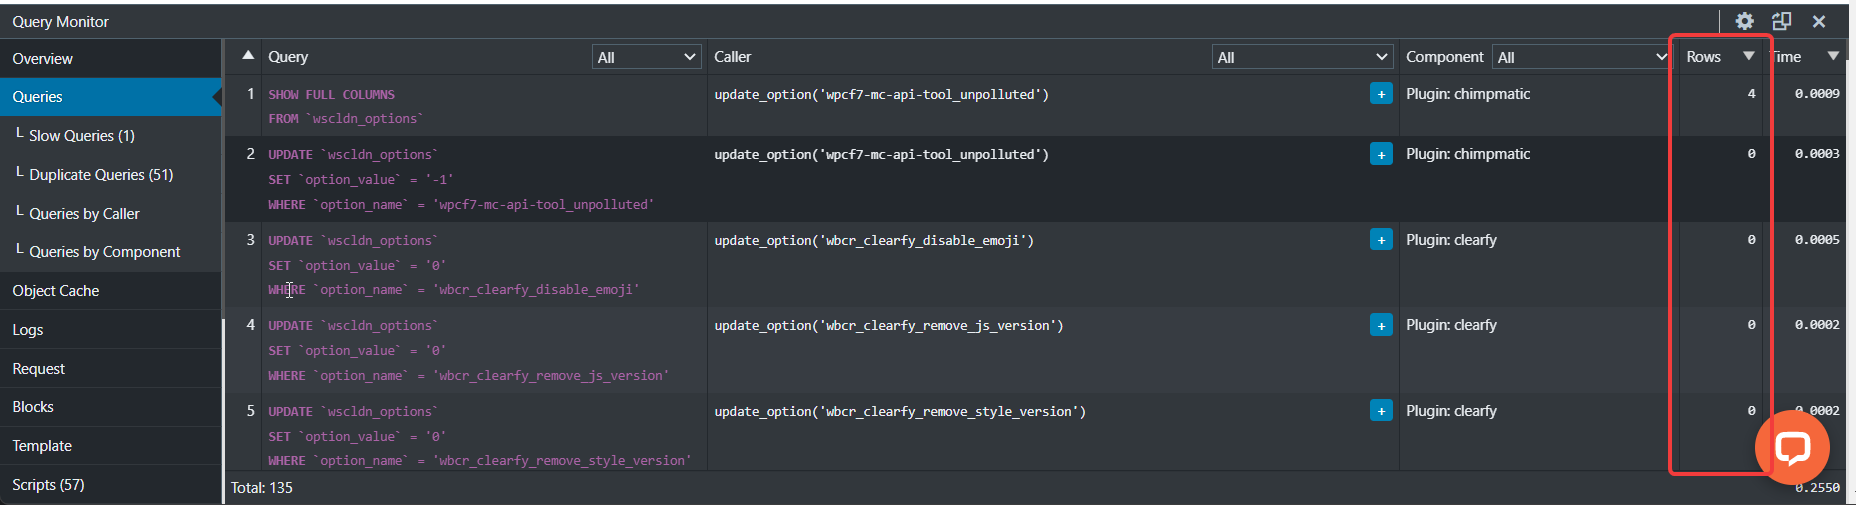
To examine this, click the Queries tab and then click the Rows header to order the queries by row count. By default, the queries are ordered in the order they are executed – so sort them by row count in descending order to discover which plugins or theme features are loading too many rows.
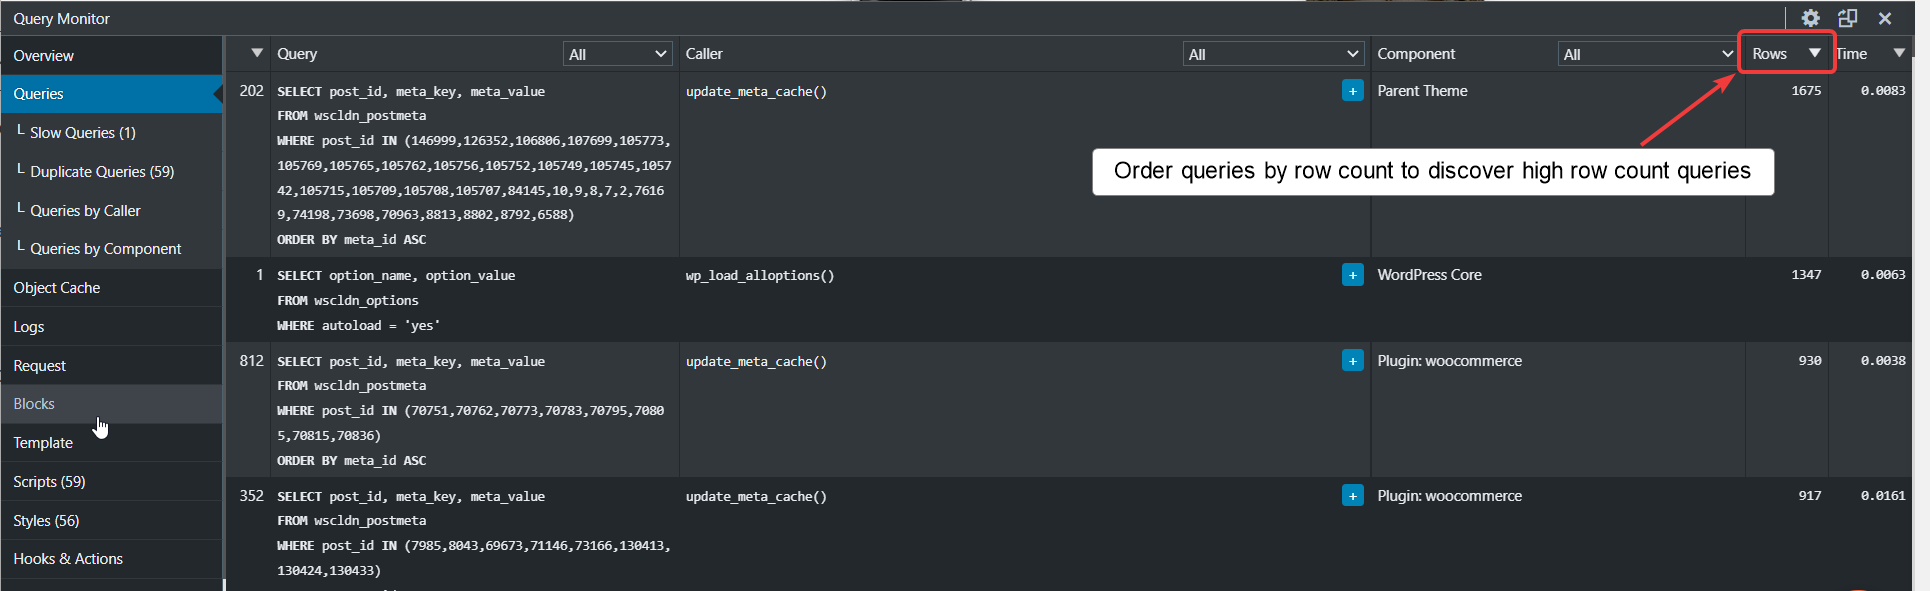
You can see in the screenshot above many queries returning roughly 1000 rows. If you have one or two of these kinds of queries, it’s probably not too problematic, but if you have dozens or hundreds of these then it will lead to excessive RAM usage, lowered concurrency (fewer simultaneous users possible) and longer page generation time.
There are a few common areas that cause this:
- wp_load_alloptions – If this is the only query you have that is returning 1000s of rows then follow our guide to optimise your wp_options table
- update_meta_cache – this is most commonly caused by WooCommerce product variations. When WooCommerce loads an archive containing variable products, it fetches ALL of the postmeta for ALL of the underlying variable products.
Optimising product variations in WooCommerce
At some point soon I will be making another attempt to optimise WooCommerce product variations, but in the meantime the best approach for these is:
- Reduce how many items appear in your archive per page. You can use infinite scroll if you like so that when a user scrolls down the 2nd page is automatically fetched.
- Enable your object cache so that only the first time these items are fetched causes the slow query time – RAM usage will remain high however
- Change your product variations to product options where possible. Variations are an option in WooCommerce by default, whereas product options are not. If you have variations which do not affect the price and do not change the image then these variation options should be changed to product options.
To expand on item 3 above, if you are selling t-shirts in different colours and different sizes, changing the colour may change the image – so that needs to be a variation. But changing the size probably does not change the image. If changing the size changes the price, if it changes the price in a consistent way – e.g. medium adds £10, large adds £15 – then these can also be switched over to product options.
If you have 30 colours and 8 sizes then your total variations per product will be 30 * 8 = 240. If you change the size in this case to a product option then you will only have 30 variations per product. That’s a reduction in RAM usage for this specific part by a factor of 8.
Drilling down to discover the source of high row counts
If you have another source of high row counts other than the 3 above, click the little blue + button to see the ‘stack trace’. This shows you the source of the query and hopefully, if the plugins functions are well-named, you’ll get an idea of the source of these high row counts.
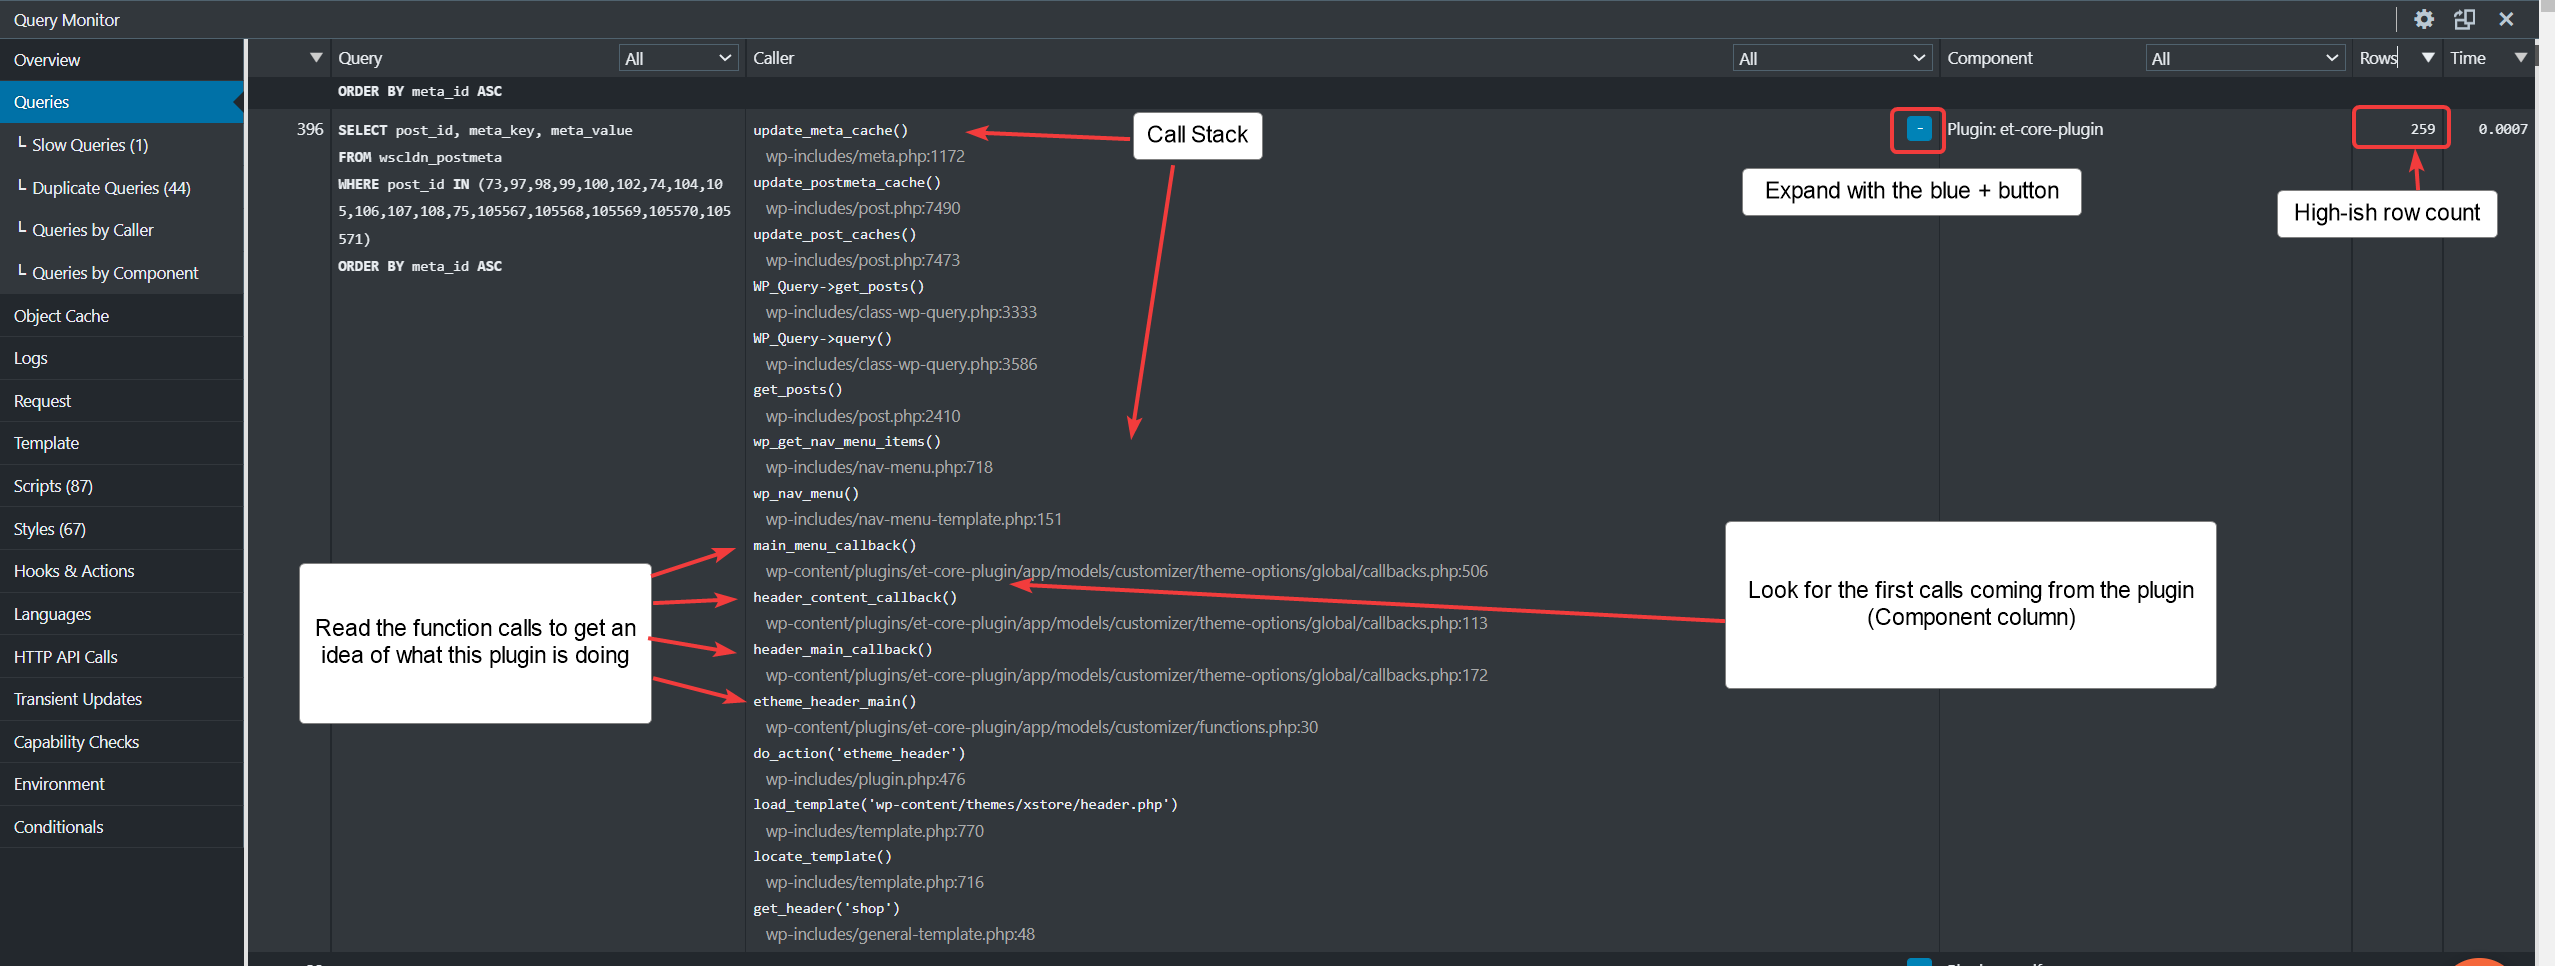
In the example above, there is a row count of 259 from the et-core-plugin. This plugin comes with the theme on this website and you can see from the function call names that this is coming from the nav menu.
To further analyse this, you can note the query number on the left hand side – in the image above, it’s query number 396 so looking at query 395 will tell us more info about why this query was executed. Clicking the arrow above the query number on the leftmost column will order the queries by the order of execution again and we will be able to see which query executed prior to 396.
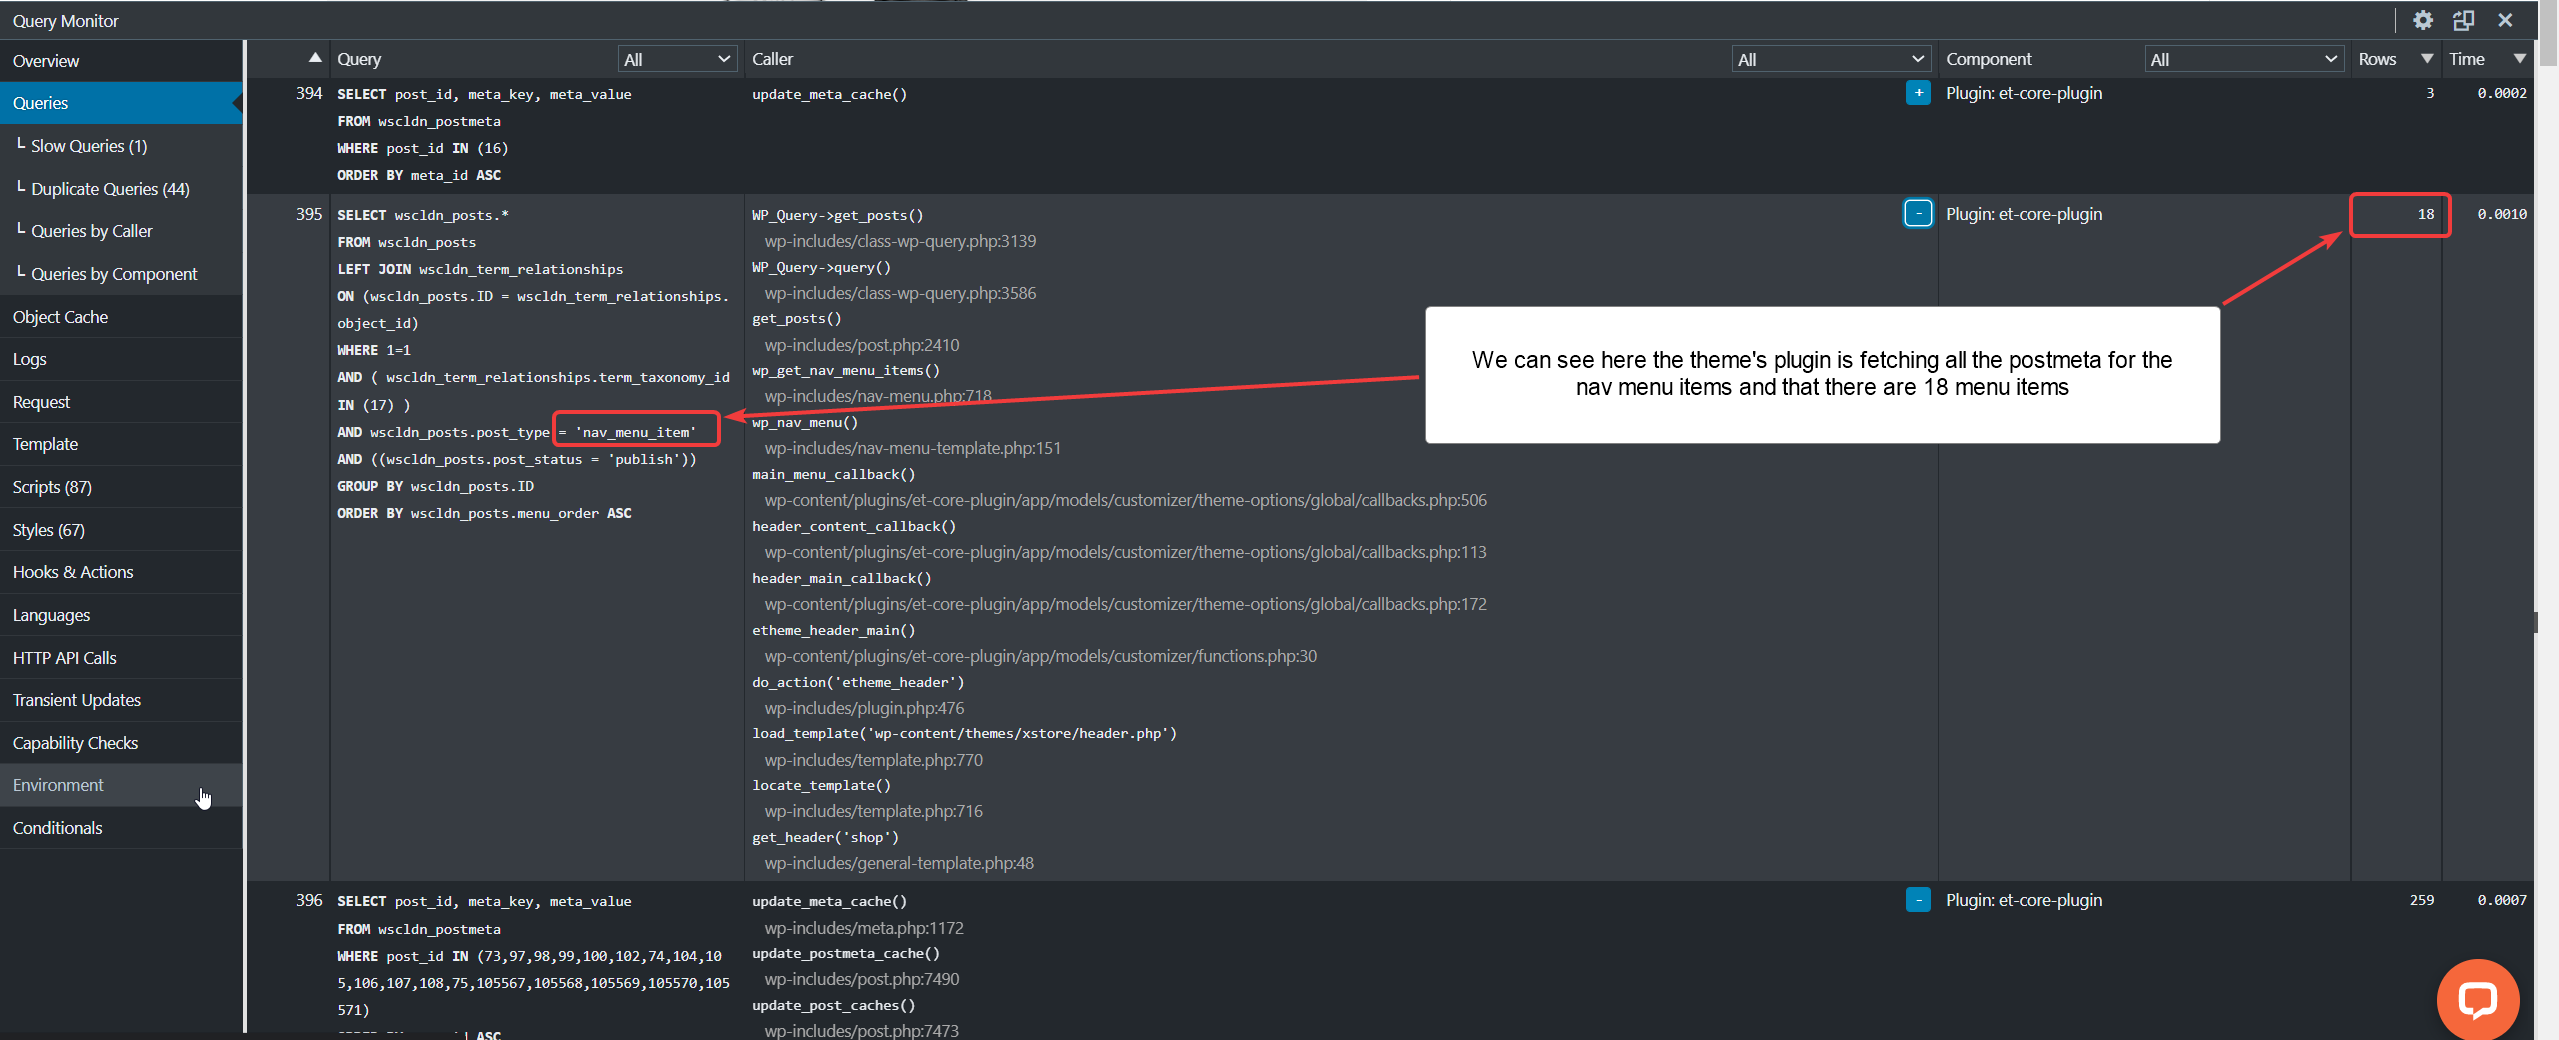
In this case, there are 18 menu items and for some reason there are 250 rows of meta data about these menu items. In this case, this is probably fine but you can use this step-by-step technique to discover the source of any potential performance problems you may be experiencing.
Examine Queries by Component to find which plugins or theme features cause excessive queries
This issue is normally less impactful than high row count plugins, but still should be examined to see if a plugin is doing something it should not – especially if these excessive queries do not reduce when you enable your object cache.
Often excessive queries are only fetching one row at a time – in these cases, it may be a non-issue, but still you should check.
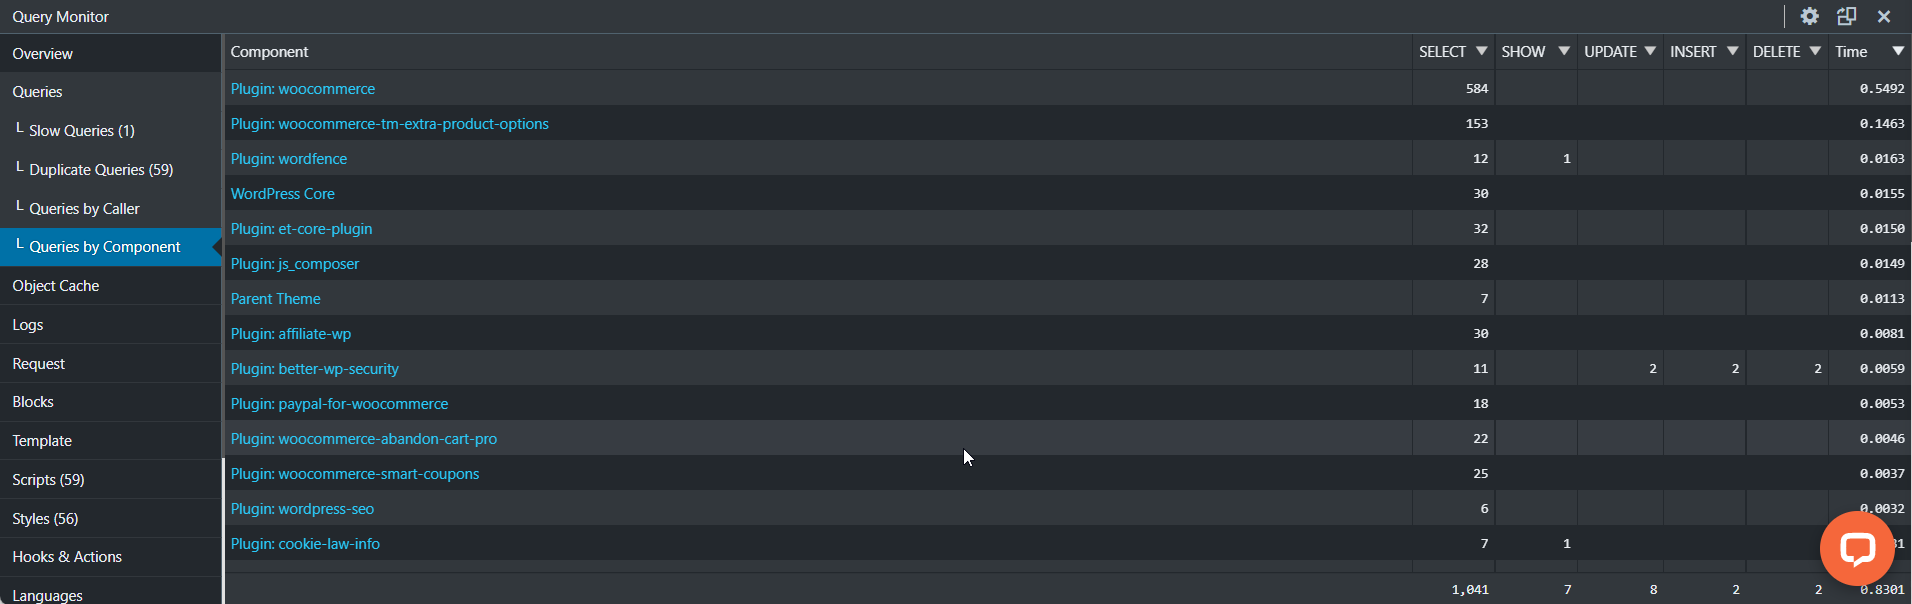
You’ll notice in the screenshot above that each plugin has a hyperlink you can click. Clicking this will bring you back to the Queries page with the queries filtered to show the queries generated by this specific plugin.
One thing to note is that you can see WooCommerce is noted here as having almost 600 queries. You should bear in mind that Query Monitor sometimes mis-allocates queries to the wrong plugin. This is because of how WordPress hooks and filters behave.
If another plugin, e.g. a WooCommerce coupon plugin, uses a WooCommerce filter then the queries inside that filter will be allocated to WooCommerce rather than to the coupon plugin. You can check this by expanding the queries with the + button and looking at the actual plugin file name in the call stack as well as for keywords like apply_filter.
Examining Slow Queries
Slow queries can be examined by clicking the Slow Queries link. Long and slow queries are normally quite easy to optimise – often they are caused by missing indexes. For example, many themes will grab the image ID of an attachment in your database by looking for the URL in the GUID column. By default, WordPress does not have an index on this column.
For these kind of issues, you can install our plugin Scalability Pro which solves most of these slow queries using indexes and sometimes with query rewrites. You can also figure out the required index yourself and add it manually. Indexes created in MySQL are auto-maintained, so creating them once is enough and they will survive database restores, migrations, etc. Don’t go too crazy – indexes cause more writes when data in the table is edited as well as sorting operations to ensure the indexes are maintained in the correct order.
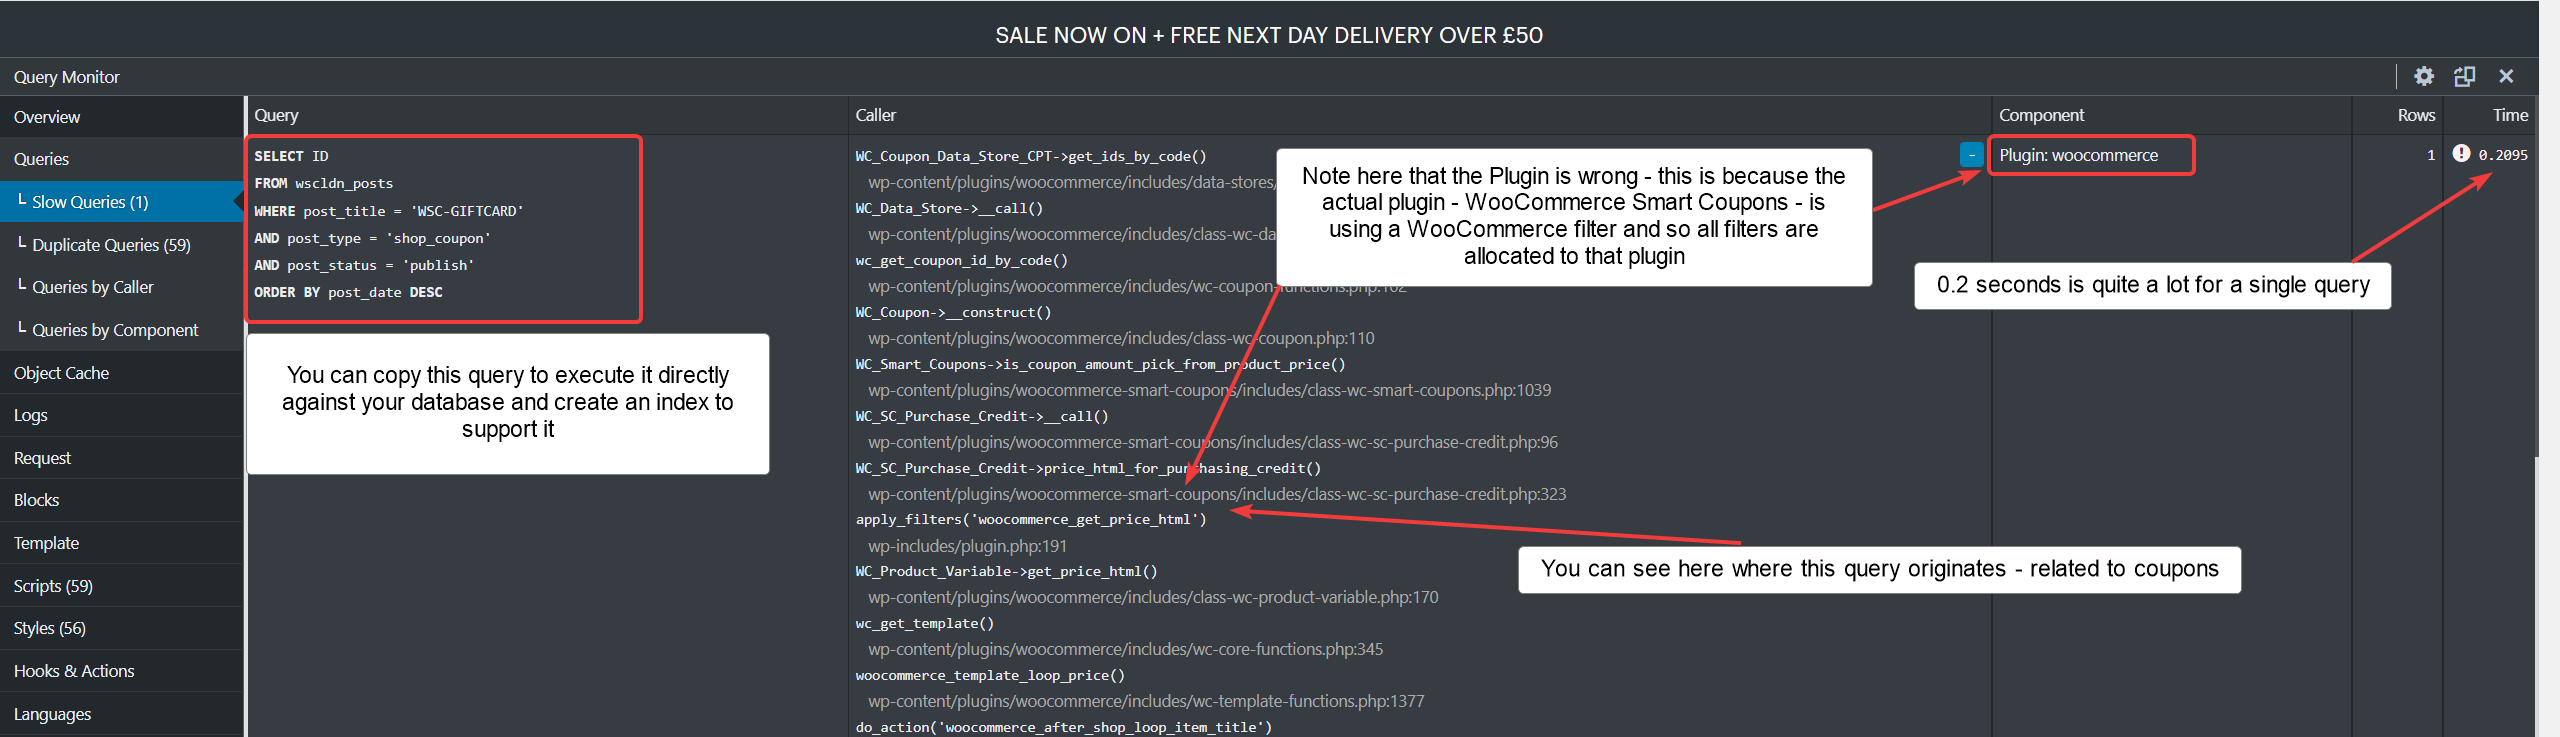
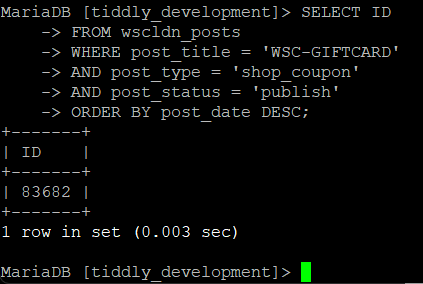
In this example, this slow query – coming from WooCommerce Smart Coupons – is checking against the post_title in the posts table.
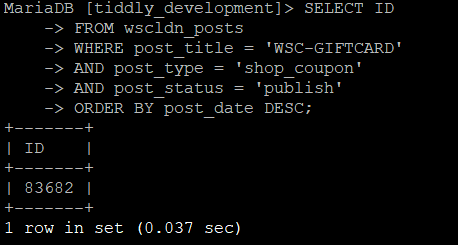
SELECT ID
FROM wscldn_posts
WHERE post_title = 'WSC-GIFTCARD'
AND post_type = 'shop_coupon'
AND post_status = 'publish'
ORDER BY post_date DESC
Although on first execution, this query took 0.2s, on subsequent execution inside the database this improves a little. That’s because MySQL has its own caching system to cache rows.
If you add the keyword EXPLAIN before the query, you will discover how many rows were examined to produce this result. So, in this case, I ran the following:
EXPLAIN SELECT ID
FROM wscldn_posts
WHERE post_title = 'WSC-GIFTCARD'
AND post_type = 'shop_coupon'
AND post_status = 'publish'
ORDER BY post_date DESC;
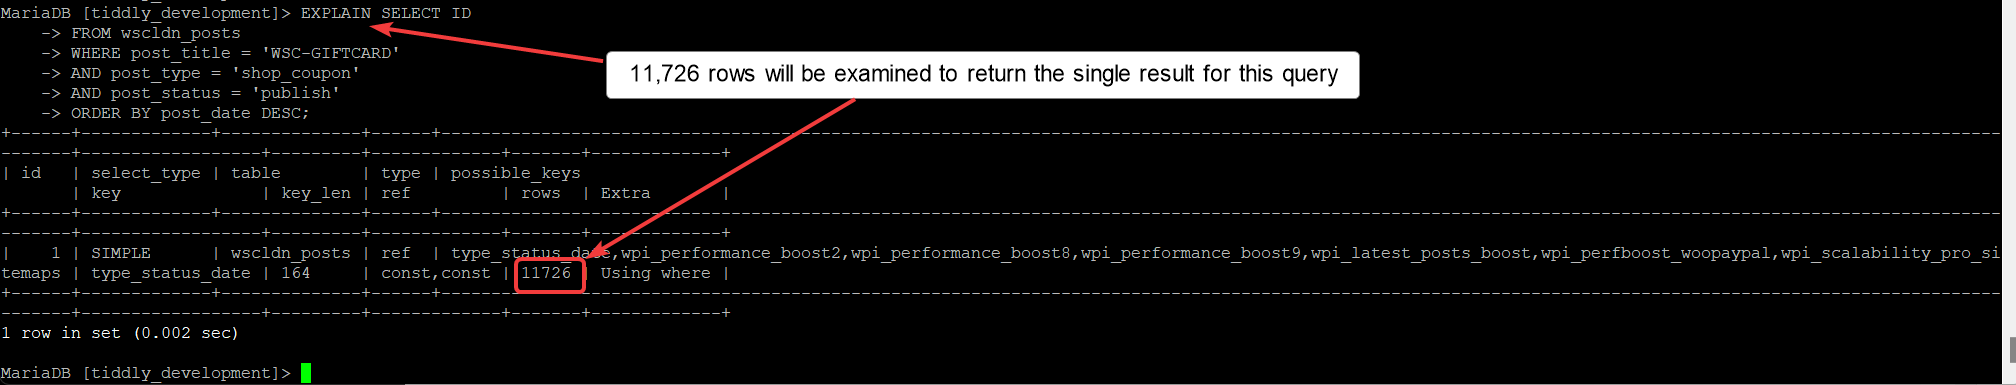
In this case, 11,726 rows are examined to produce a single result. The more data you have in wp_posts, the slower this type of query will become.
To fix this, an index on post_title, post_type and post_status will definitely help although an index on just post_title will probably be enough.
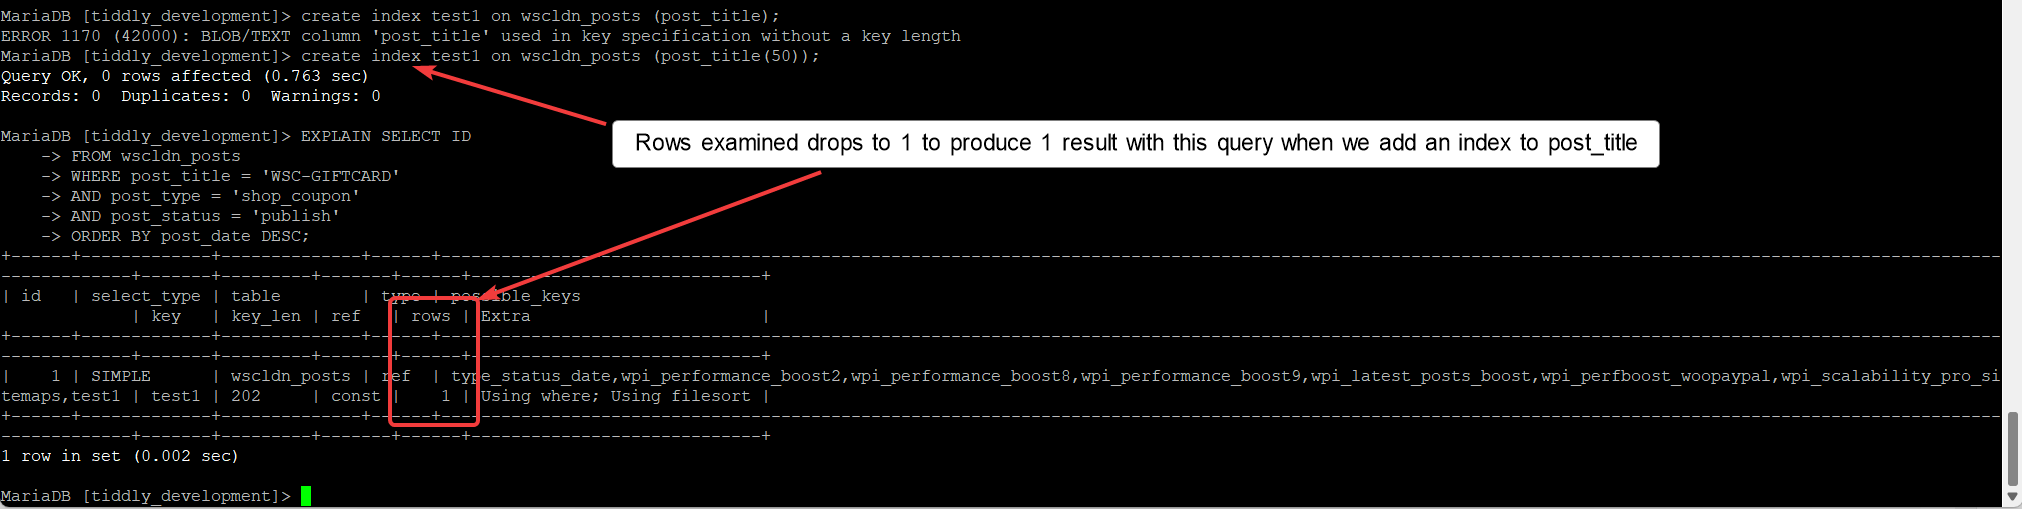
The post_title column is a blob/text column, so you have to limit how large the index is. I typically limit this to 50 characters. That doesn’t mean if a post_title is larger than 50 characters that it won’t be indexed, it just means that the first 50 characters will be indexed. If you have two similar titles which are longer than 50 characters then the query would have to examine 2 rows instead of 1. This is all way better than examining 12,000 rows and remember that number will only increase the larger your site becomes.
create index test1 on wp_posts (post_title(50));
You can see that it’s possible to manually create these indexes where required to speed up slow queries, but we’ve also made this easy for you by adding these indexes directly inside our Scalability Pro plugin.
Eliminating excessive queries and high row counts
If you have discovered some plugins that are causing your site to have high row count queries and/or high query counts, the quickest and easiest way to check the real impact of this plugin is to deactivate the plugin and reload the page. Note the before and after numbers for query counts, RAM usage and total execution time.
Obviously the plugin or theme may actually be required by your site so what then?
The first thing to check is if maybe this part of the code is an option inside the plugin and/or theme. Commonly, themes add terrible code for showing a ‘Discount percentage’ instead of your regular sales flash, and using that example you could find the option in your theme or plugin and disable it while still retaining the rest of the functionality.
Another option is to use the awesome Asset Cleanup Pro plugin (not affiliated with Super Speedy Plugins) – this plugin not only lets you disable CSS and JS that is loaded unnecessarily, it also lets you disable the entire plugin on a per-page basis.
For example, the official Mailchimp plugin adds 50MB RAM usage to one of my client’s websites on all front-end pages when the newsletter sign up form isn’t even present. Using Asset Cleanup Pro it’s possible to disable the badly coded Mailchimp plugin on all the front-end pages except the newsletter management page, and keep it active on the back-end pages for CRON/scheduled emails etc.
The final option is to dig into the code. If a filter is present in the code before the badly written part it may be possible to rewrite the code using your functions.php file without killing the ability to update your theme/plugin. Worst case scenario, you may need to rewrite the actual code inside the plugin but that is beyond the scope of this article.
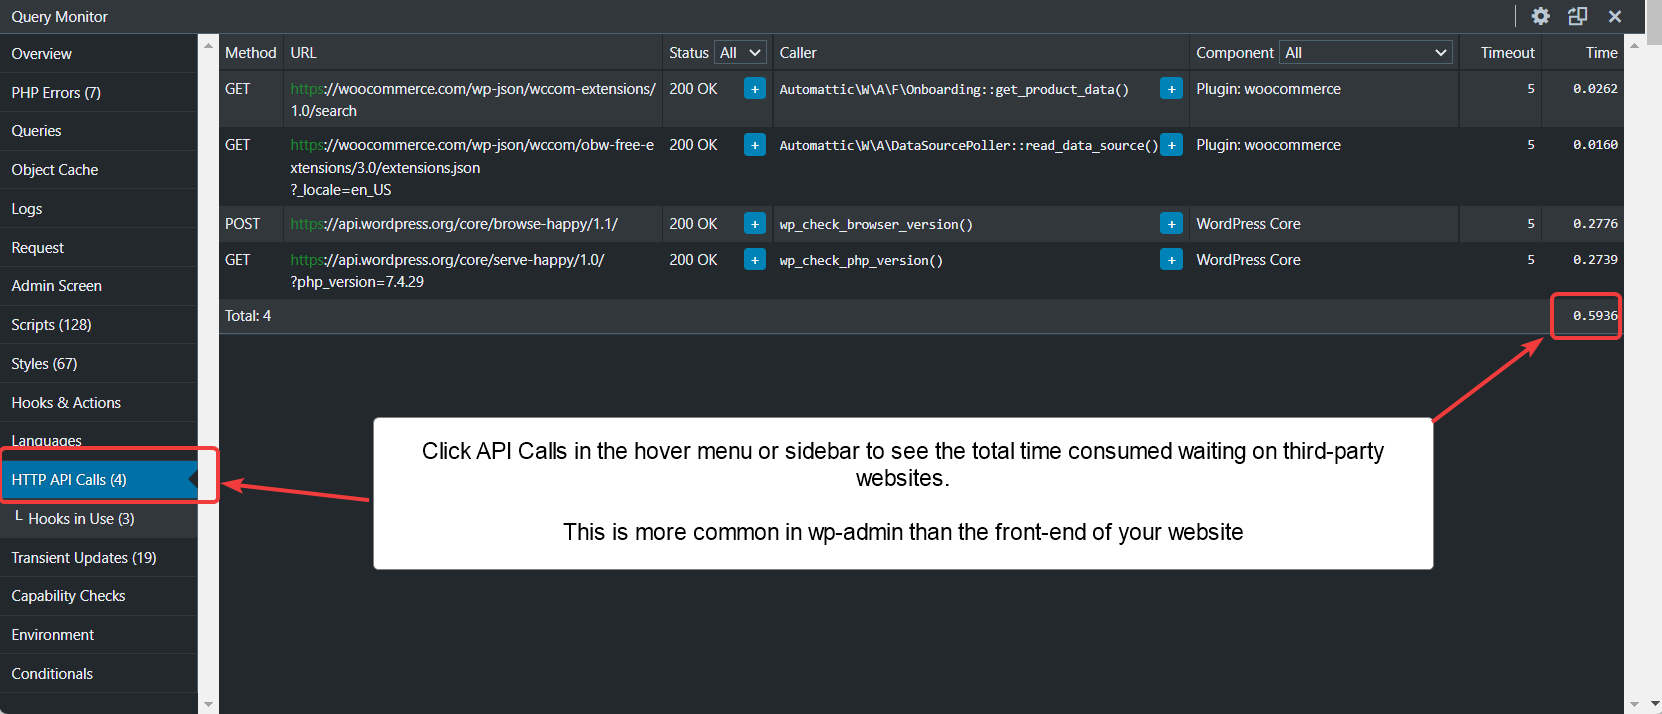
Analysing slow API calls
The total execution time presented in Query Monitor is PHP time + API calls + MySQL time. Normally on your site front-end there are no API calls, but like one of our super users discovered, this *can* happen. See how he analysed this WooCommerce API issue here.
Analysing Bulk Edits
If your admins are finding bulk editing of products or orders is slowing to a crawl, firstly you need to be aware that bulk edits happen using Ajax. That means you will not see the Query Monitor results, you’ll just see a spinner while you wait.
To analyse bulk edit speed, you should edit a single product or order using the full edit page. Whatever happens on this page when you make the edit will also happen in the bulk edit page.
Commonly, there are actions added to ‘edit product’ and ‘edit order’ with ‘edit order’ being the area that suffers the most. Commonly you’ll find multiple API calls to third-party CMS, third party order management systems and more. Optimising or eliminating these through editing a single order will vastly speed up your bulk editing processes and bring sanity back to your site admins.
Summary
Query Monitor is by far the best tool available to analyse WordPress performance issues. It has some limitations, but if you follow the guide above you should be able to identify and solve most WordPress performance issues on your own.
If you need even more advanced tools to analyse performance, the best is really xDebug. You can find articles about xDebug right here on our site.
Remember to re-enable your object cache after you have finished your analysis, and when you are deactivating plugins or plugin features to measure their impact you should ideally be doing this on a dev/staging clone of your live site. All good hosts make it easy to clone your site so if your hosting company does not let you create clones easily you should consider switching hosts. Seriously.


Hi Dave, this was very helpful, thank you! The section on adding indexes to tables is new to me but I would love to read more to understand further. Are there any resources you would recommend? Thanks again
There’s not really a perfect resource out there to be honest. I’ll make sure and get something written up to help explain how to create indexes yourself if you have uncovered slow queries that would benefit.
In the meantime, there is the official MySQL documentation which is a little tricky to read: https://dev.mysql.com/doc/refman/8.0/en/mysql-indexes.html
And there’s a quite good article from spinupwp about indexes with some examples: https://spinupwp.com/wordpress-database-optimization-indexing/