Xdebug is a great tool to assist with stubborn performance issues. Commonly used for debugging code, if you use it on a staging server with conditional breakpoints and the tips below, it can help you identify and fix your performance bottlenecks far more quickly than otherwise possible.
This guide presumes you are using VS Code locally and Ubuntu on your remote server.
Table of Contents
- Install Xdebug on your remote server
- Configure Xdebug to start when requested
- Configuring your server for Debug & Profiling
- Configuring your server only for Debug
- Install the VS Code Remote Development extension
- Connect to the Remote Host
- Open the remote web folder
- Run & Debug using Xdebug
- Install the Xdebug Chrome/Firefox Extension
- Breakpoints Tip
- Generating cache grind profiles using Xdebug
Install Xdebug on your remote server
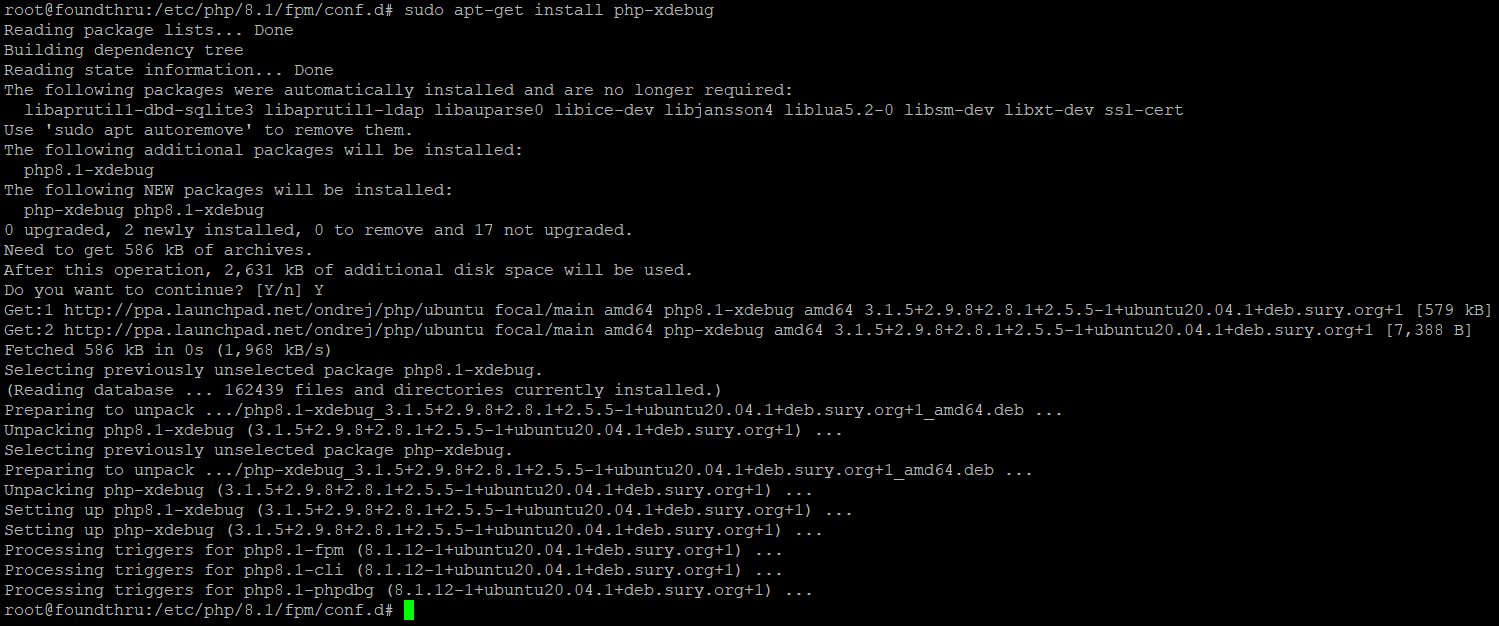
SSH into your remote server and run the following to install Xdebug:
sudo apt-get install php-xdebug
Note: Depending on how many versions of PHP you have installed, you may have to use something like this:
sudo apt-get install php8.3-xdebug
Configure Xdebug to start when requested
Now, presuming you are using PHP 8.1, list the files in the PHP conf.d folder:
ls /etc/php/8.1/fpm/conf.d/ -l
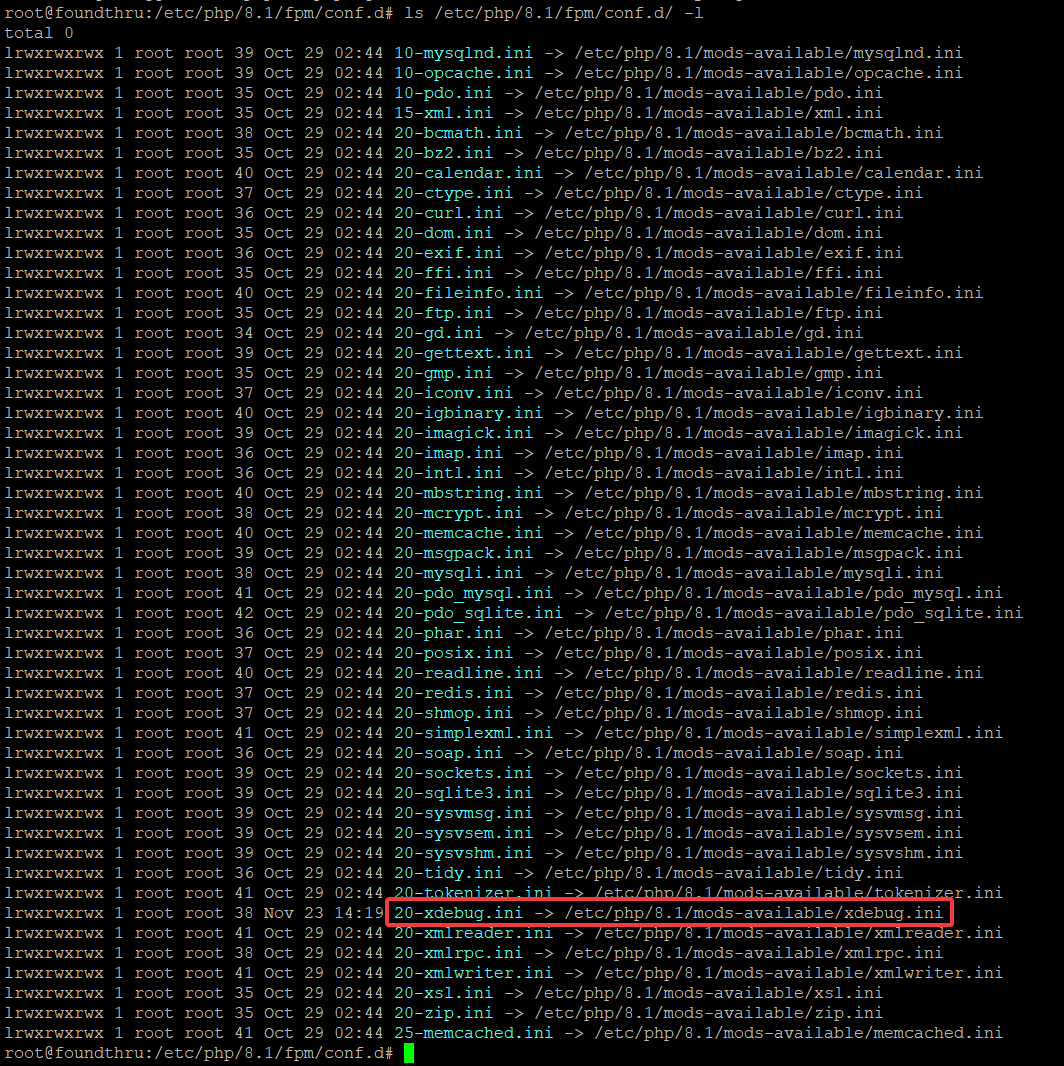
You can see from the screenshot above that the 20-xdebug.ini file actually is a symlink to a file that comes with the module installation. For this reason, you shouldn’t edit this file to complete your config. Instead, create a new file called 99-xdebug.ini and edit that:
vi /etc/php/8.1/fpm/conf.d/99-xdebug.ini
Configuring your server for Debug & Profiling
Profiling can be very useful to get hold of cache grind files, but additionally it will consume a LOT of disk space on your server.
Add the following to /etc/php/8.1/fpm/conf.d/99-xdebug.ini:
xdebug.mode = debug,profile
xdebug.start_with_request = trigger
You’ll notice above 2 modes are enabled, debug and profile. These can both be selected by using the xdebug helper chrome/firefox extension. Debug mode lets you hit breakpoints and step through code whereas profile mode lets you generate stack traces which should be dumped by default into your server’s /tmp/ folder.
Note the trigger value will come from the chrome/brave/firefox/edge extension you install later and this will ensure you only debug and interrupt pages from your browser. This is especially helpful if you are debugging a staging server where other tests may be underway.
Configuring your server only for Debug
Configuring for debug is probably what most of you will need. To enable for that, add only the following to /etc/php/8.1/fpm/conf.d/99-xdebug.ini:
xdebug.mode = debug
xdebug.start_with_request = trigger
Restart your PHP service with:
sudo service php8.1-fpm restart
Install the VS Code Remote Development extension
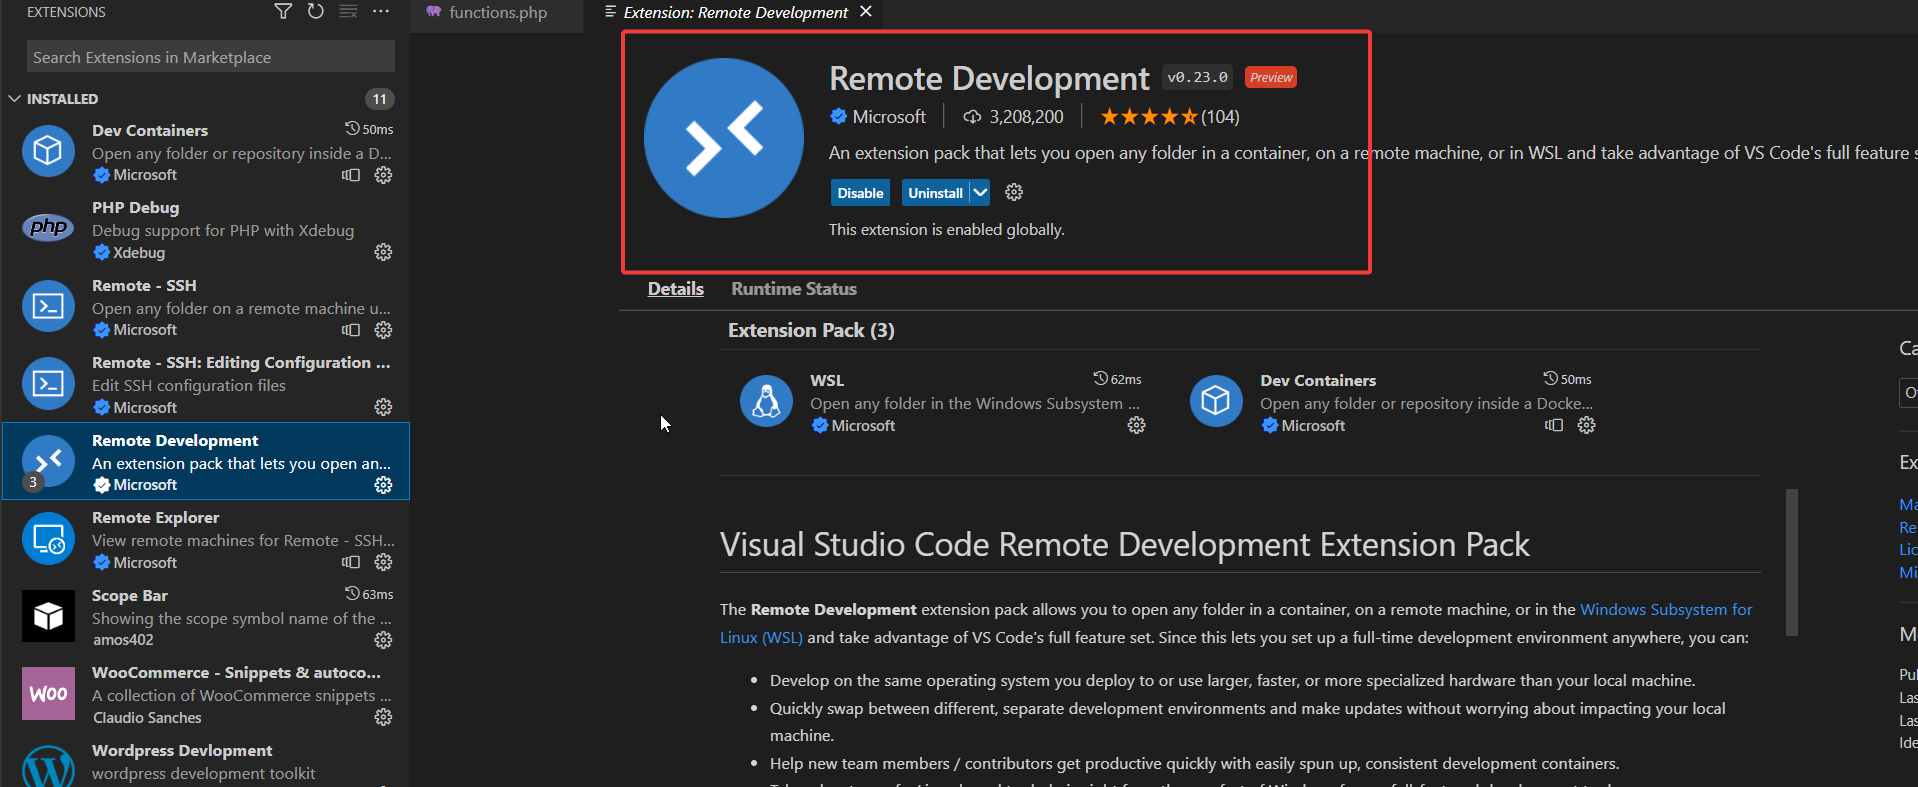
Inside VS Code, click the Extensions tab and search for Remote Development.
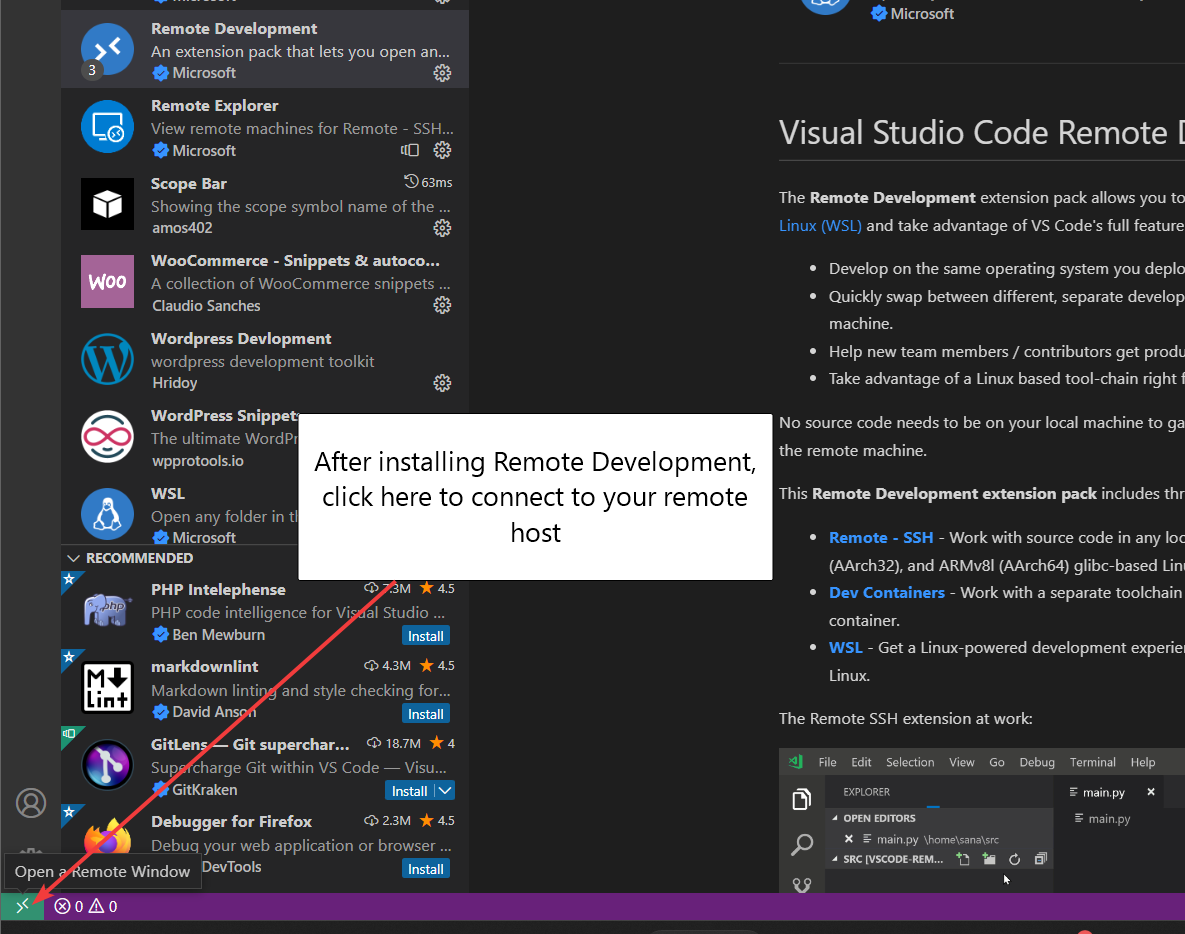
After installation, you’ll see a little green icon to the bottom left of VS Code. Click this to connect to your remote host.
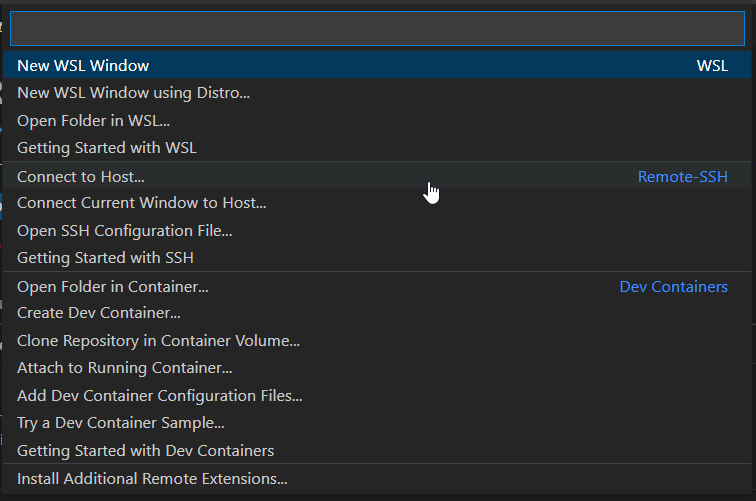
In the next window, click Add New Host and then enter the ssh command that should be used to connect, e.g. ssh root@remoteipaddress. Then choose which config to save this to – typically the top one to save to your user profile. This will save your SSH config which you can then edit.
Your ssh config file will look like this but we need to tell it where the local key is located.
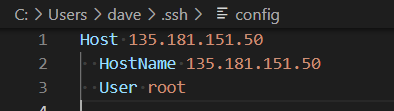
Add the following two lines and adjust the IdentifyFile line to include a link to your private key:
ForwardAgent yes
IdentityFile ~/.ssh/id_rsa
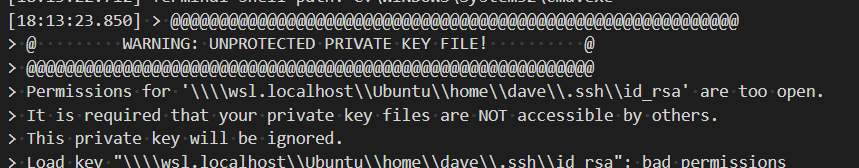
Using WSL, by default VS Code will consider ~ to be your Windows user folder (e.g. C:Usersdave). To instead use your WSL Ubuntu folder, use the following path for the IdentityFile (change the username to your username instead of dave):
IdentifyFile \wsl.localhostUbuntuhomedave.sshid_rsa
Alternatively, copy your private key to your user folder under the .ssh folder.
You should also ensure your public key exists on the remote server. Add it under whichever user folder you are connecting to in the .ssh/authorized_keys file.
If you don’t already have a private/public key pair, from inside WSL or your local Ubuntu run ssh-keygen and your keys will typically be saved to ~/.ssh/id_rsa and ~/.ssh/id_rsa.pub. Copy the contents of the id_rsa.pub file to your remote ~/.ssh/authorized_keys file.
Connect to the Remote Host
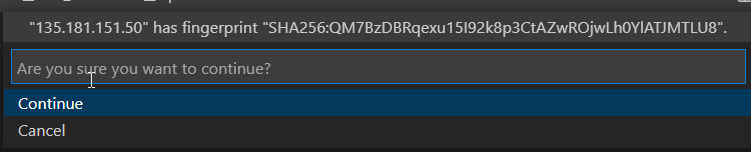
Now that you have your remote SSH configured, click the green icon again and choose your remote host IP address.
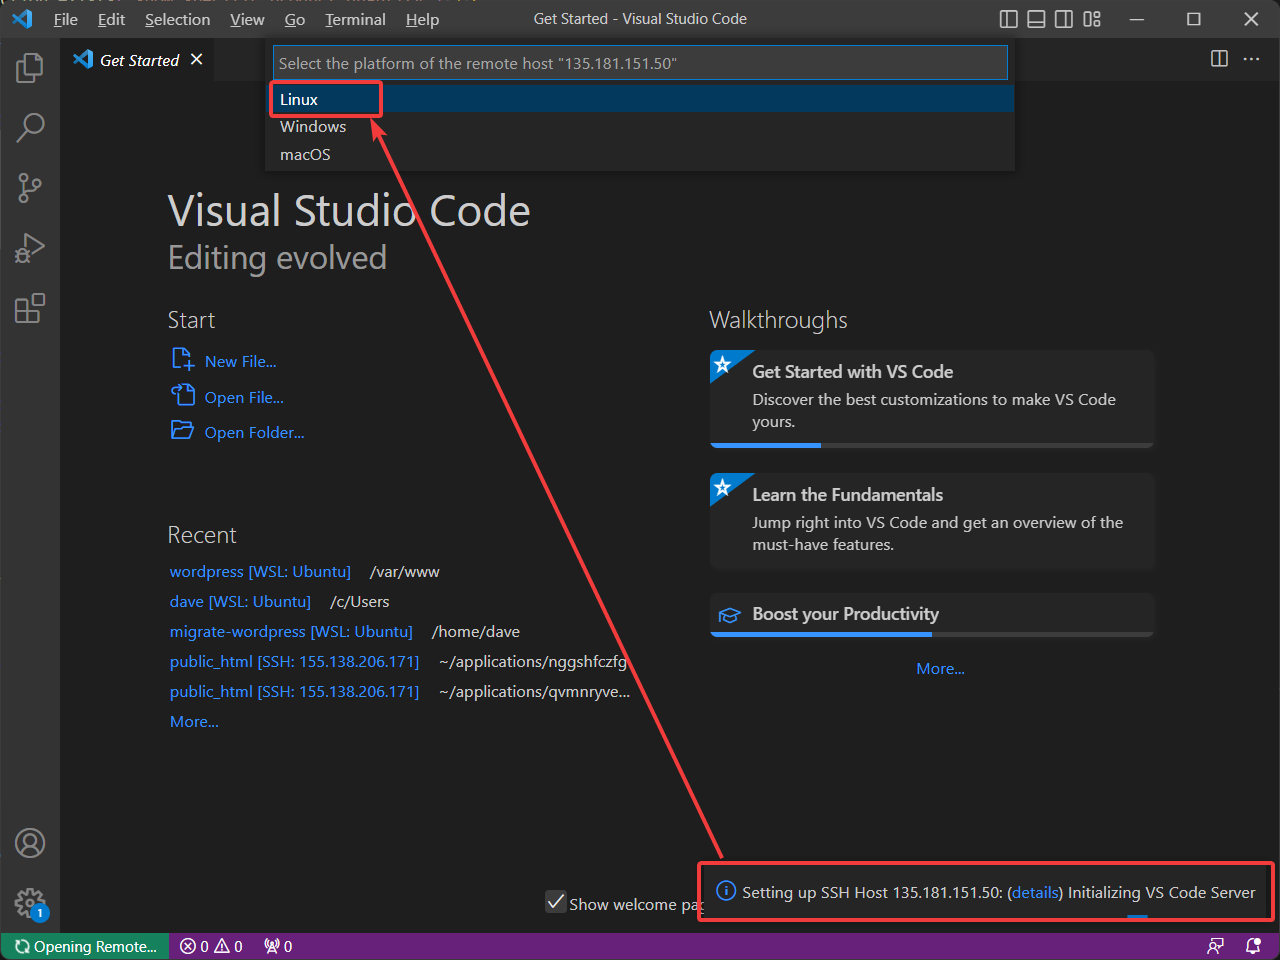
Click Linux (presumably) to tell VS Code that the remote server is linux-based.
If VS Code fails to connect, you can examine the Output tab to see the reasons. The most common failure is due to insecure permissions for your private key. Ensure it is configured so only YOU can read the file.
Open the remote web folder
The next step in remote debugging and performance analysis is to open the remote web folder. With Gridpane servers, this will be /var/www/domain.com/htdocs/
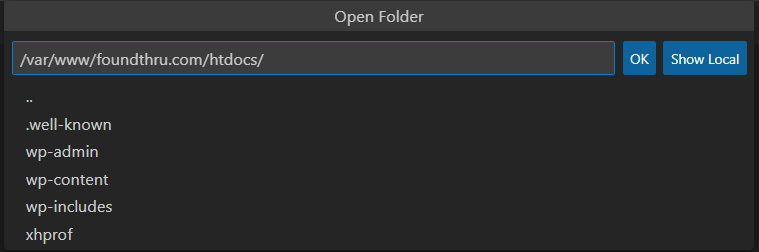
Now you have direct access to all your remote web files from your local VS code.
Run & Debug using Xdebug
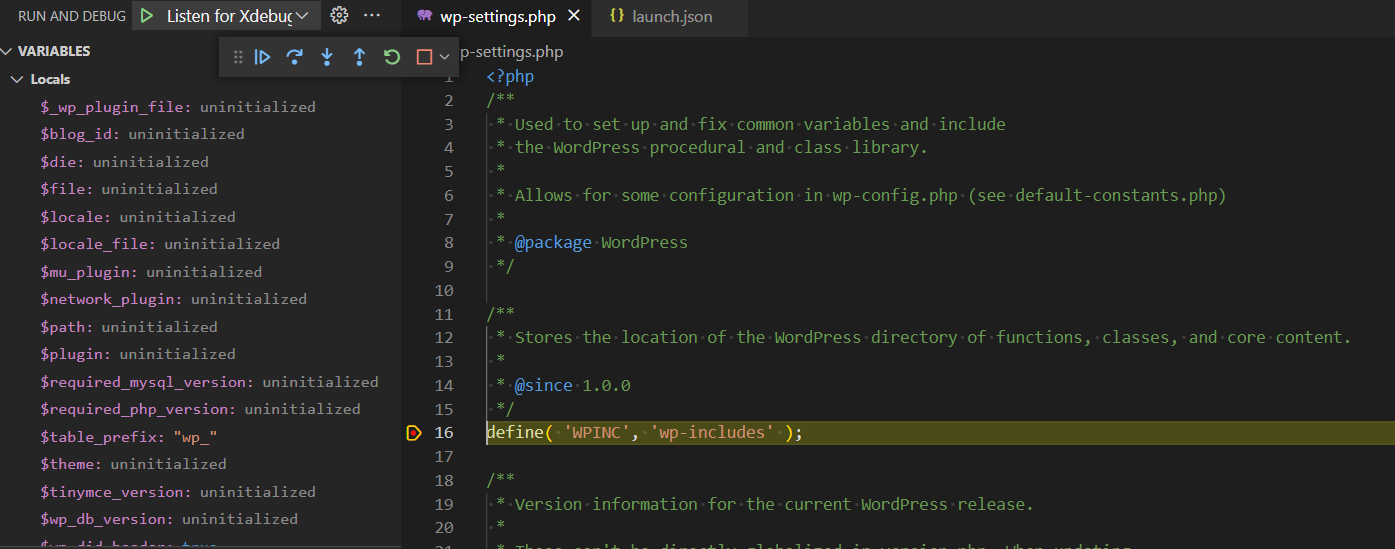
Open the wp-settings.php file and you’ll notice that you cannot add breakpoints yet.
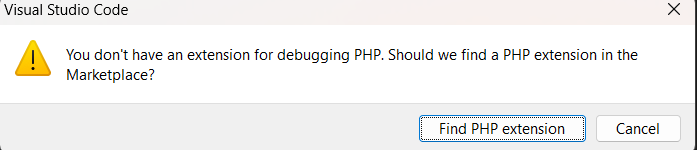
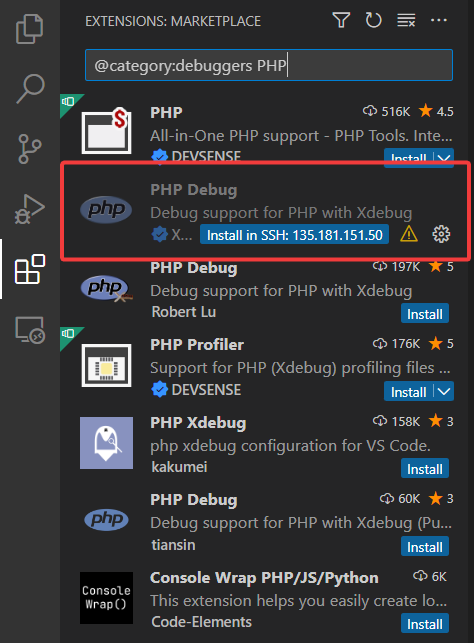
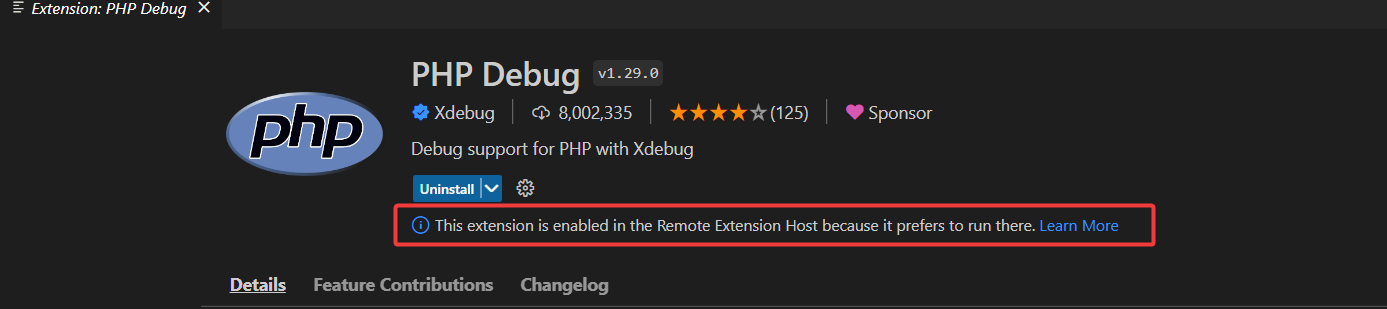
Next click Find PHP Extension and VS Code should re-use your local PHP debugger. I want to use the same debugger I use locally and as you can see in the screenshot, VS Code provides a button to Install in SSH. Click to Install in SSH.
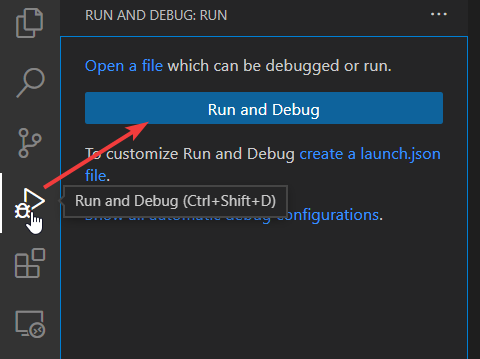
Now, from the Debug tab, click the text link to create a launch.json file. Without this, you will only be able to run & debug your current file which is not much use in WordPress.
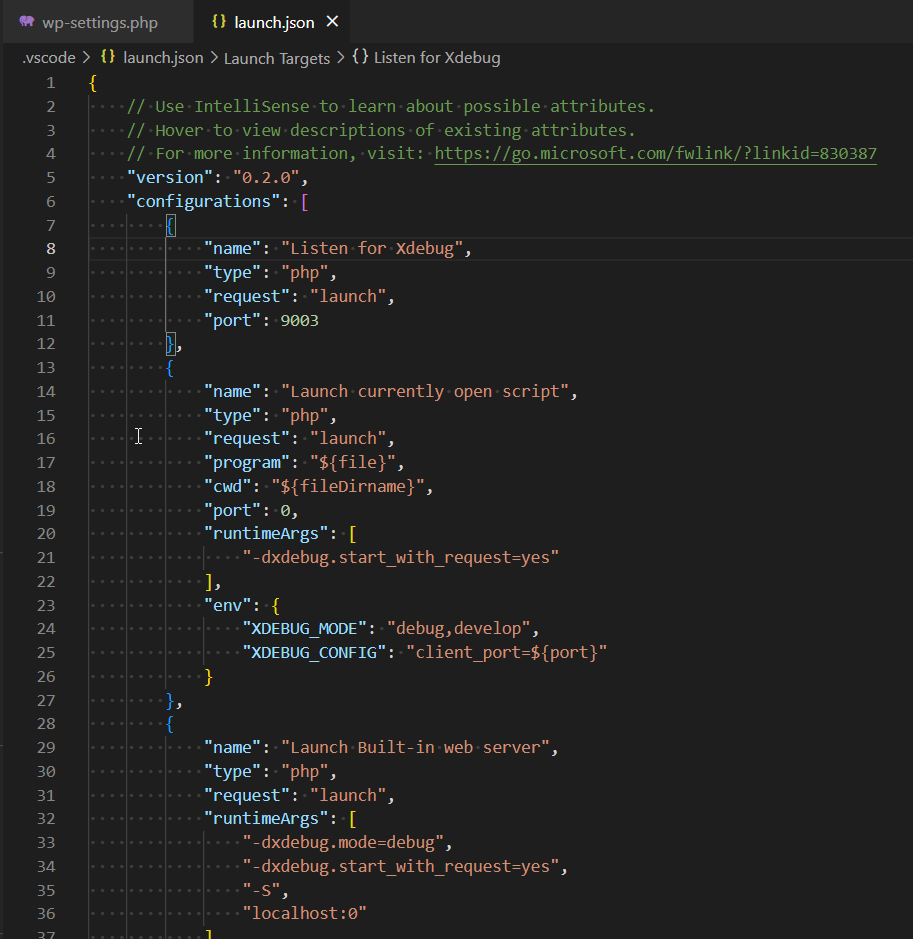
You’ll notice in your launch.json file that the XDEBUG_MODE environment mode is set to debug,develop. This is good as it means we won’t generate expensive trace files while debugging. Now that you have your launch.json file, you can click Listen for Xdebug and then load a web page which you’re working on.
Install the Xdebug Chrome/Firefox Extension
We don’t want to debug ALL traffic, just our own traffic from our own browser – installing the Xdebug browser extension helps with this.
But really, it’s useful to have this. To use the Xdebug helper, install the extension then configure its options.
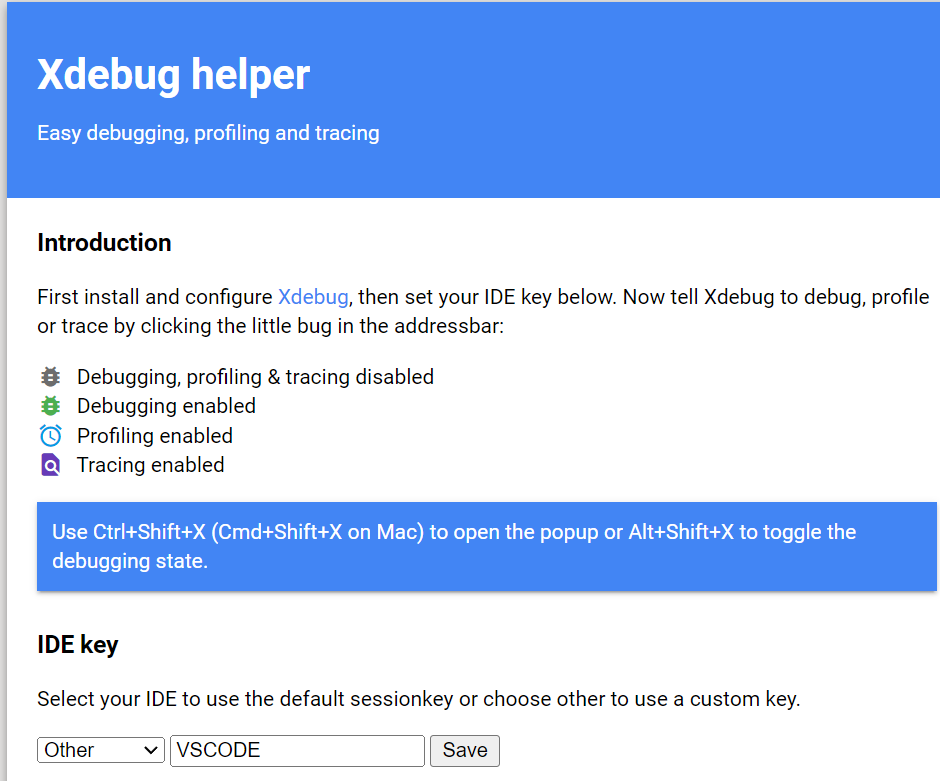
After installing xdebug helper, right click the extension > options.
Choose OTHER and enter the IDE KEY of VSCODE.
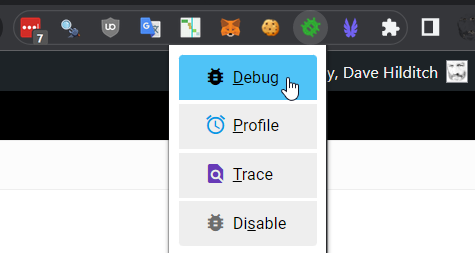
Now, when you click on the Xdebug helper you can switch between debug mode and profile mode.
Add a breakpoint to wp-settings.php or similar, click Play in VS Code then click on the Xdebug helper, choose Debug and then click to Listen for Xdebug inside VS Code and refresh your URL. You should see the breakpoint being hit.
Any breakpoints will now pause execution on your remote server.
From here you can step through as normal, or add breakpoints in code you’ve identified as having performance issues.
Breakpoints Tip
Using Query Monitor, with your Object Cache switched off, you can quickly find which lines of code are responsible for queries grabbing 1000s of rows. Adding a breakpoint in the code at these lines will help you understand the performance impact here. (most commonly developers loop through the results and build PHP objects consuming excessive time and RAM)
Dave Hilditch
Generating cache grind profiles using Xdebug
To gather trace files – cache grind files – with the config above, this is now a simple matter.
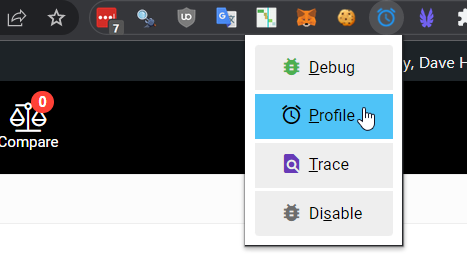
Click the Xdebug helper extension and choose Profile:
Now when you load any pages on your website you will find they load a little more slowly. This is to be expected since the profiles generate cachegrind.out files which are quite large, about 100MB per URL loaded.
If you navigate to your /tmp/ folder on your server, you will find fresh cachegrind files. I personally find it useful to download these and rename them as soon as possible – e.g. rename them to the page type you were loading or the URL you were accessing to help you diagnose.
Create well named folders for your cache grind files to help you understand which request these cache grind files were for
One thing to be aware of – on many pages you will generate multiple cache grind files. This happens because there is the initial PHP page being loaded and then one or more Ajax calls that occur.
To make sense of these files, keep them grouped together for each page call you profile, name the folder and download them to your computer for analysis with QCacheGrind 64-bit version.
To analyse cache grind files takes a bit of practice, but it can really help you figure out where to place your breakpoints in your code and drill down further to investigate performance issues. Derrick Rethans has a good intro video to analysing cache grind files.